Featured Projects
1. Data Analytics Library (Python · Reference Toolkit)

A documented Python library implementing the full analytics lifecycle — loading, streaming ingestion, cleansing, EDA, visualization, and descriptive → diagnostic → predictive → prescriptive analysis, plus a reusable ML pipeline. DataFrame-in / DataFrame-out modules, 81 pytest tests, and GitHub Actions CI on Python 3.10–3.12.
Tools: Python, pandas, scikit-learn, matplotlib, pytest, GitHub Actions
View Details2. Profit Erosion from E-Commerce Returns (Python · Streamlit)
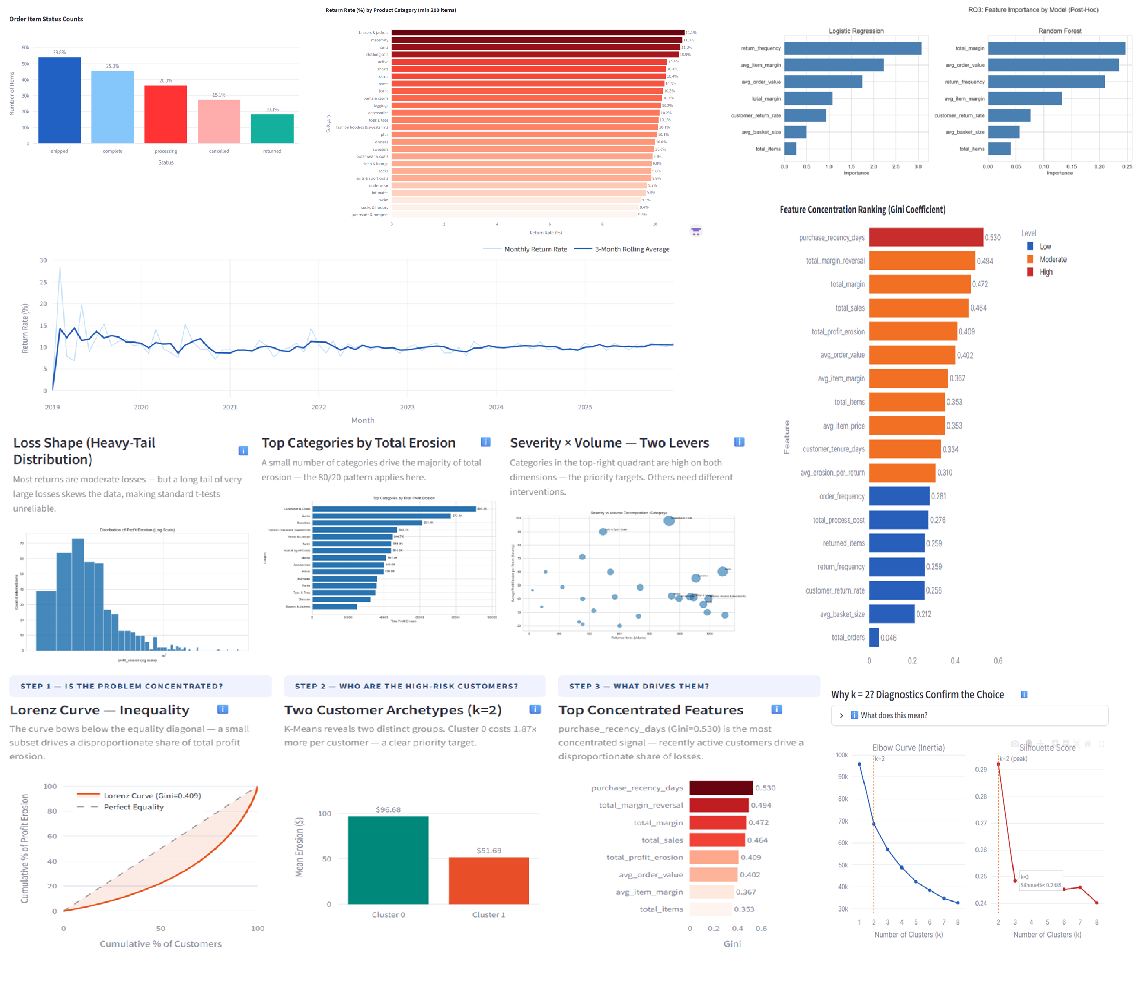
MDA Capstone project quantifying financial losses from e-commerce product returns. Multi-method framework: K-Means segmentation, Random Forest (AUC 0.98), log-linear regression, and a live Streamlit dashboard with 5 interactive pages.
Tools: Python, scikit-learn, Streamlit, BigQuery, statsmodels, GitHub Actions
View Details3. Warzone Armory (AI-Native Full-Stack App)
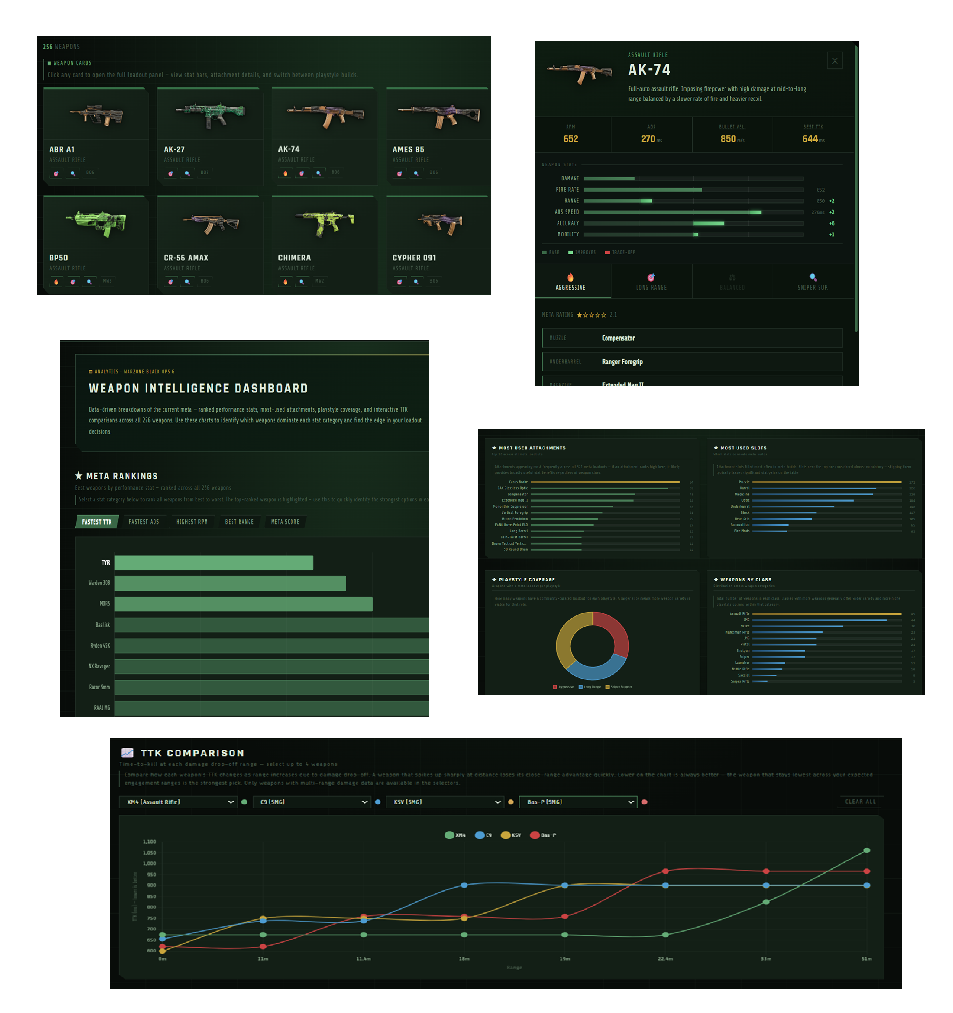
Full-stack app built end-to-end with Claude Code. Daily Python scraper via GitHub Actions cron, 256+ weapon database, playstyle filtering, and an analytics dashboard — deployed on GitHub Pages with no backend infrastructure.
Tools: Python, GitHub Actions, Claude Code, Vanilla JS, GitHub Pages
View Details4. Spotify Data 2023 – Top Songs Analysis (SPSS)
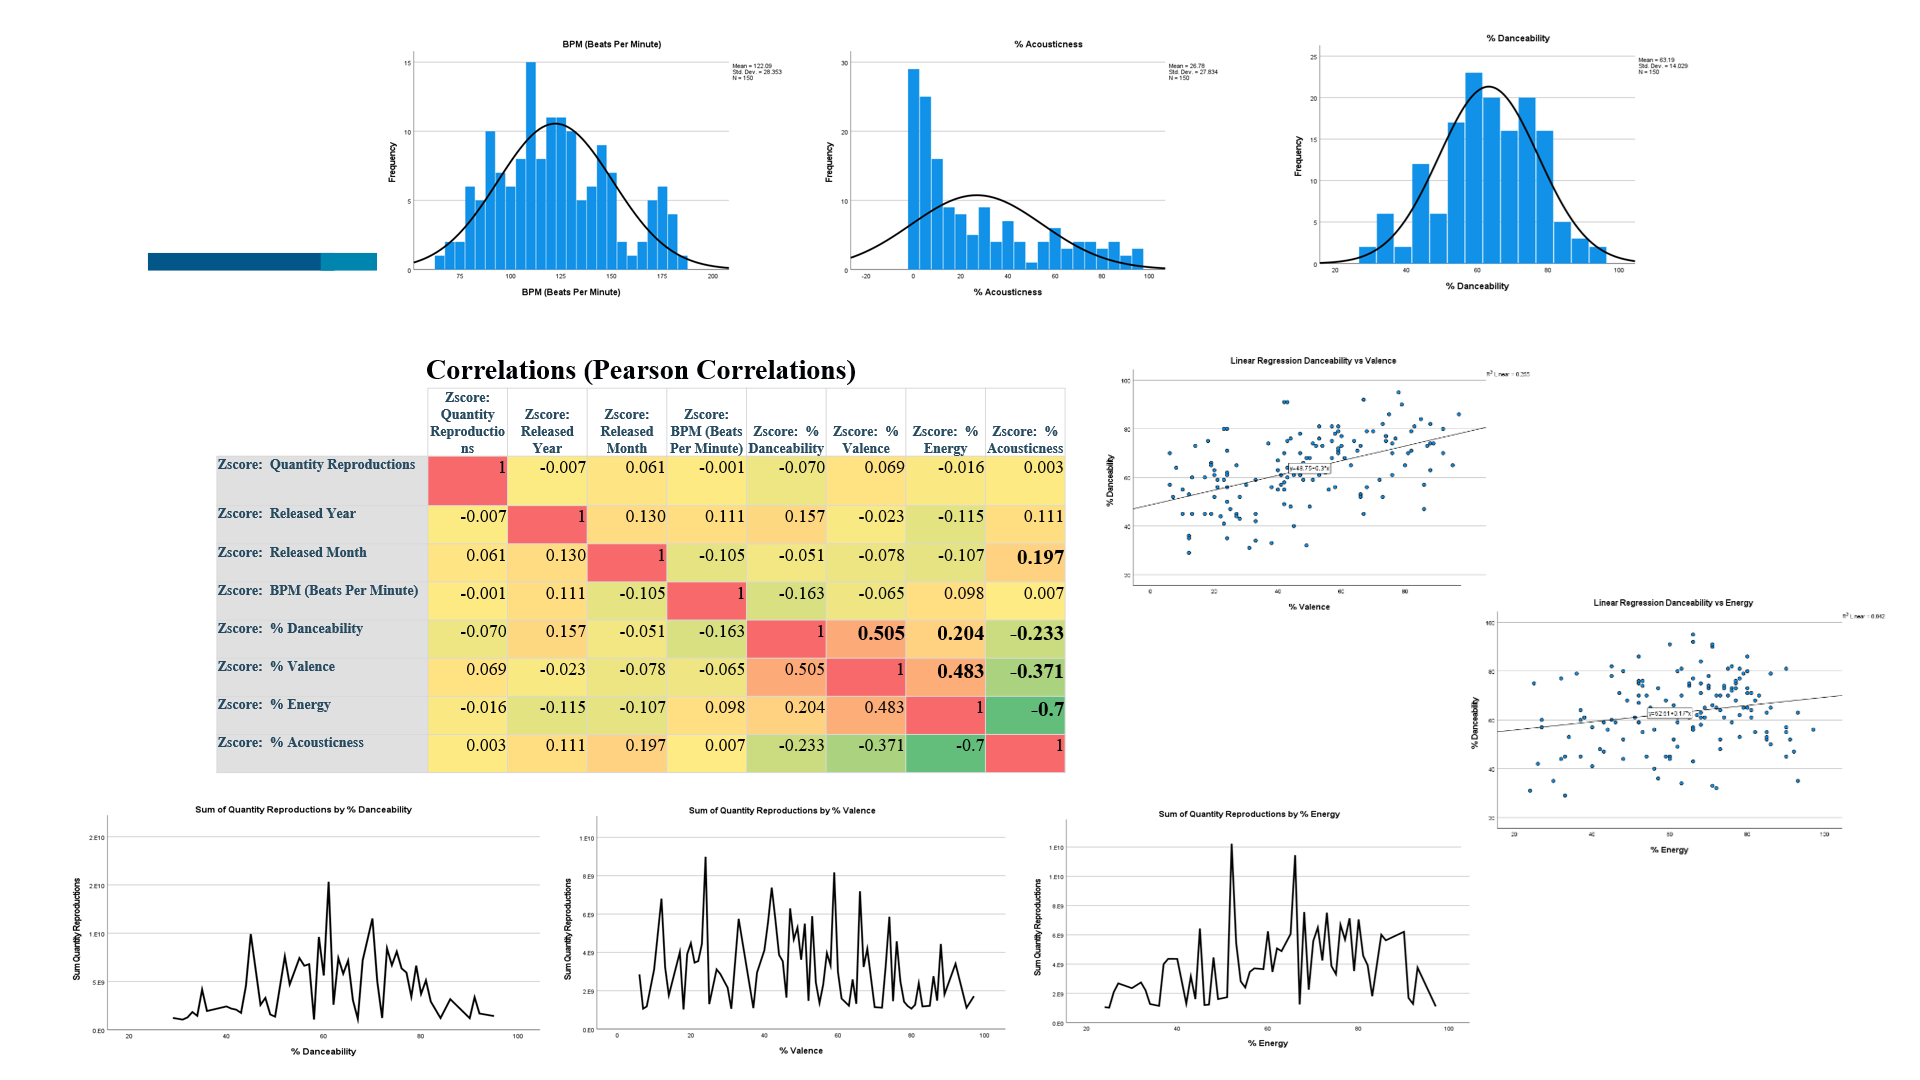
Exploratory analysis of Spotify's top tracks in 2023 using SPSS and statistical correlation techniques.
View Details5. Traffic Accident Prediction (Python)

Regression modelling to forecast traffic accident risk in Toronto using weather and location data.
View Details6. Sales Forecasting (Power BI)
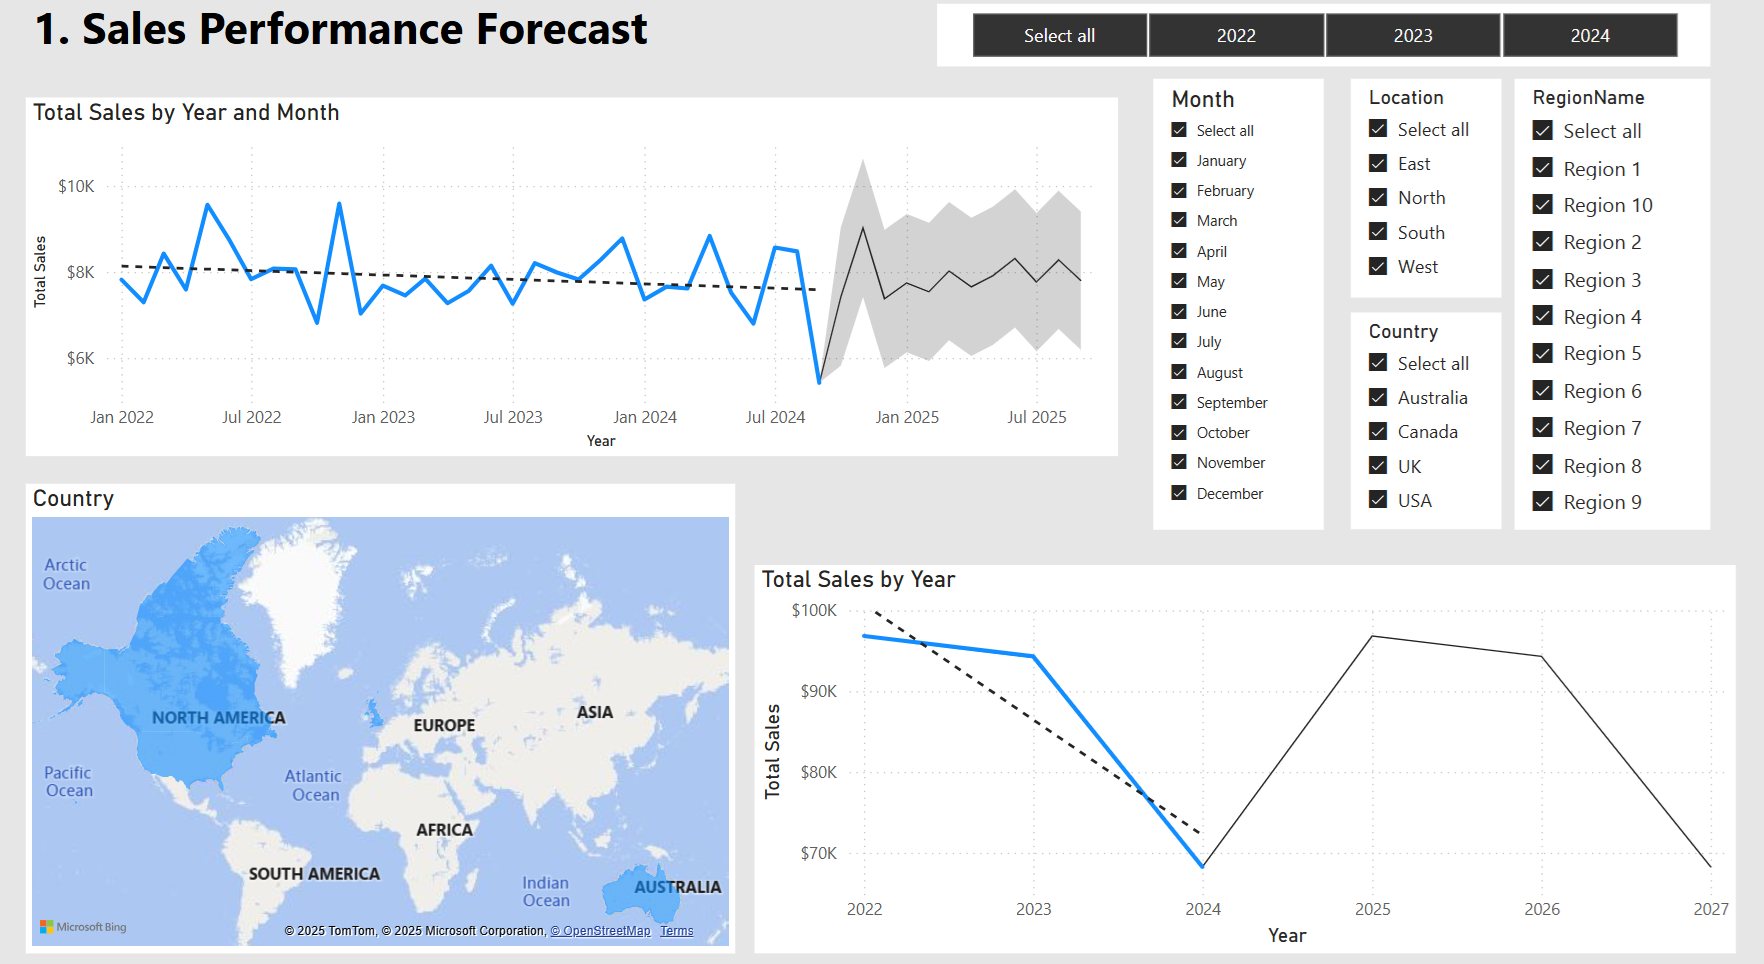
Forecast sales performance, customers, and profitability using interactive visuals in Power BI.
View Details7. Electric Vehicles Analysis (Python + Power BI)
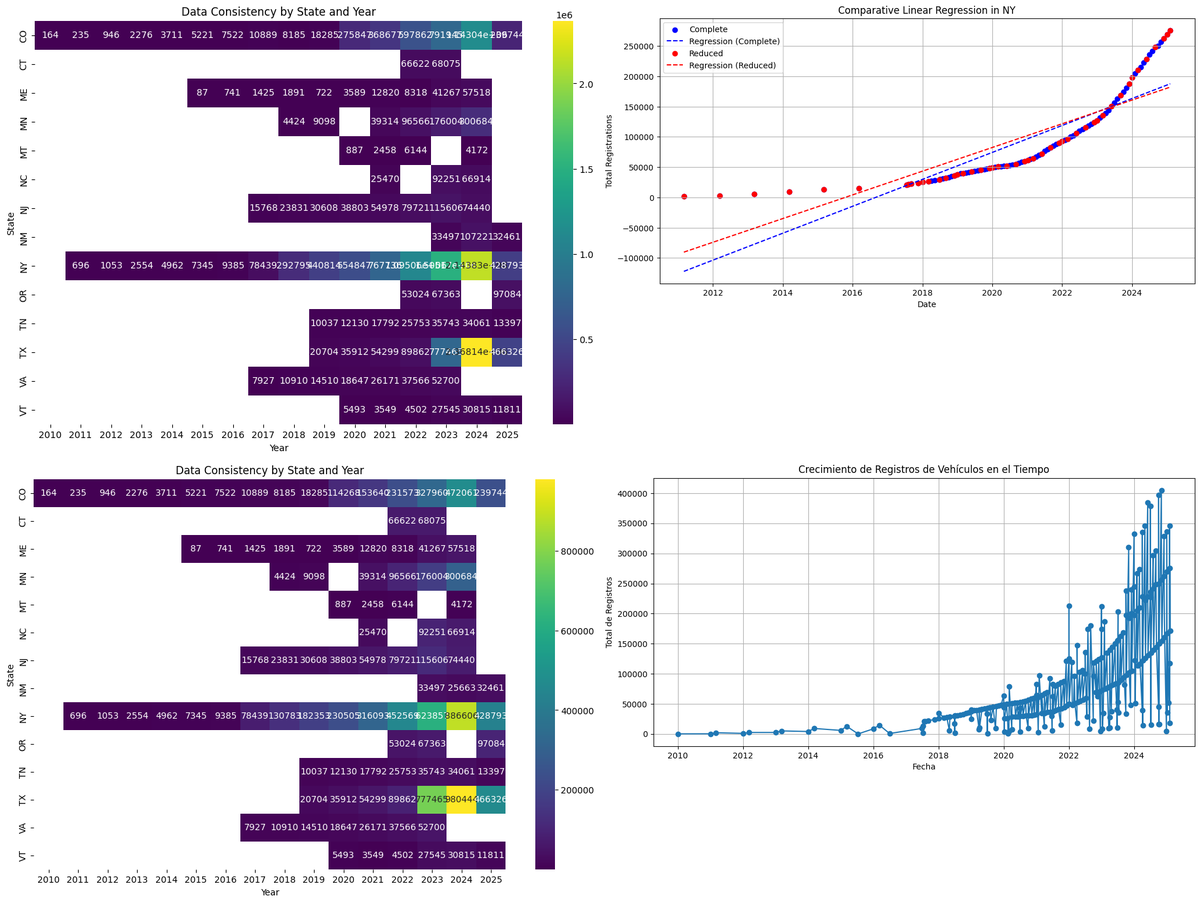
Exploratory and statistical analysis of electric vehicle registrations using Python and Power BI. Includes regression models, data consistency validation by state, and growth trends over time.
View Details8. LAPD Crime Data Analysis (Python)
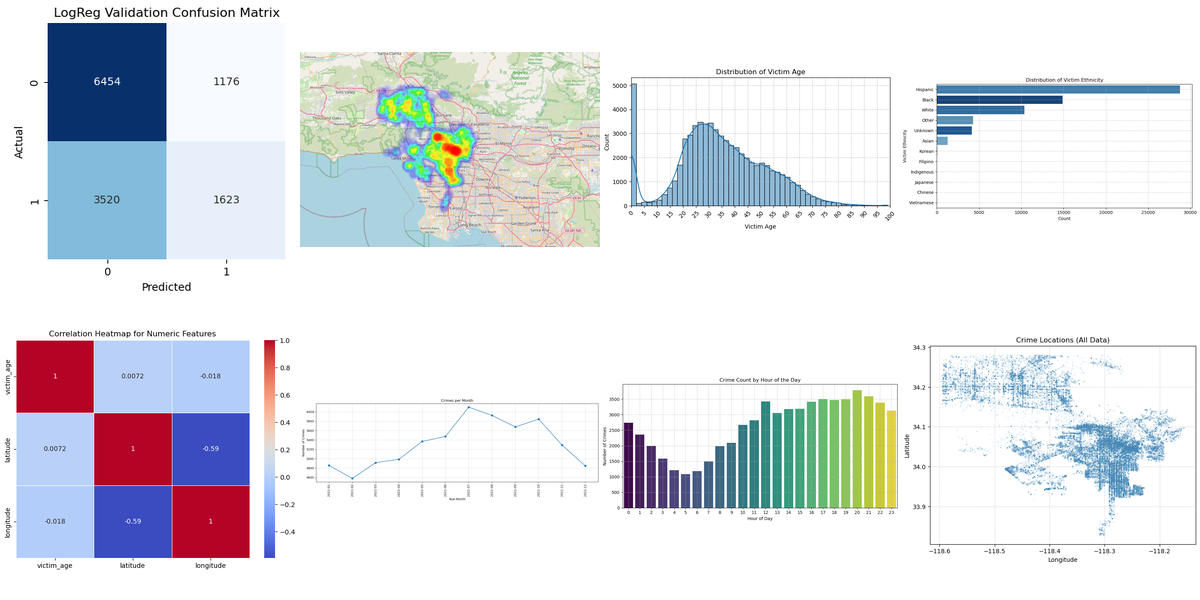
Predictive and exploratory analysis of the Los Angeles Police Department Crime Dataset using Python. Includes EDA, feature engineering, demographic insights, spatial heatmaps, and Random Forest modeling to identify the key drivers of crime case solvability.
View Details9. Superstore Sales Analysis (Tableau)
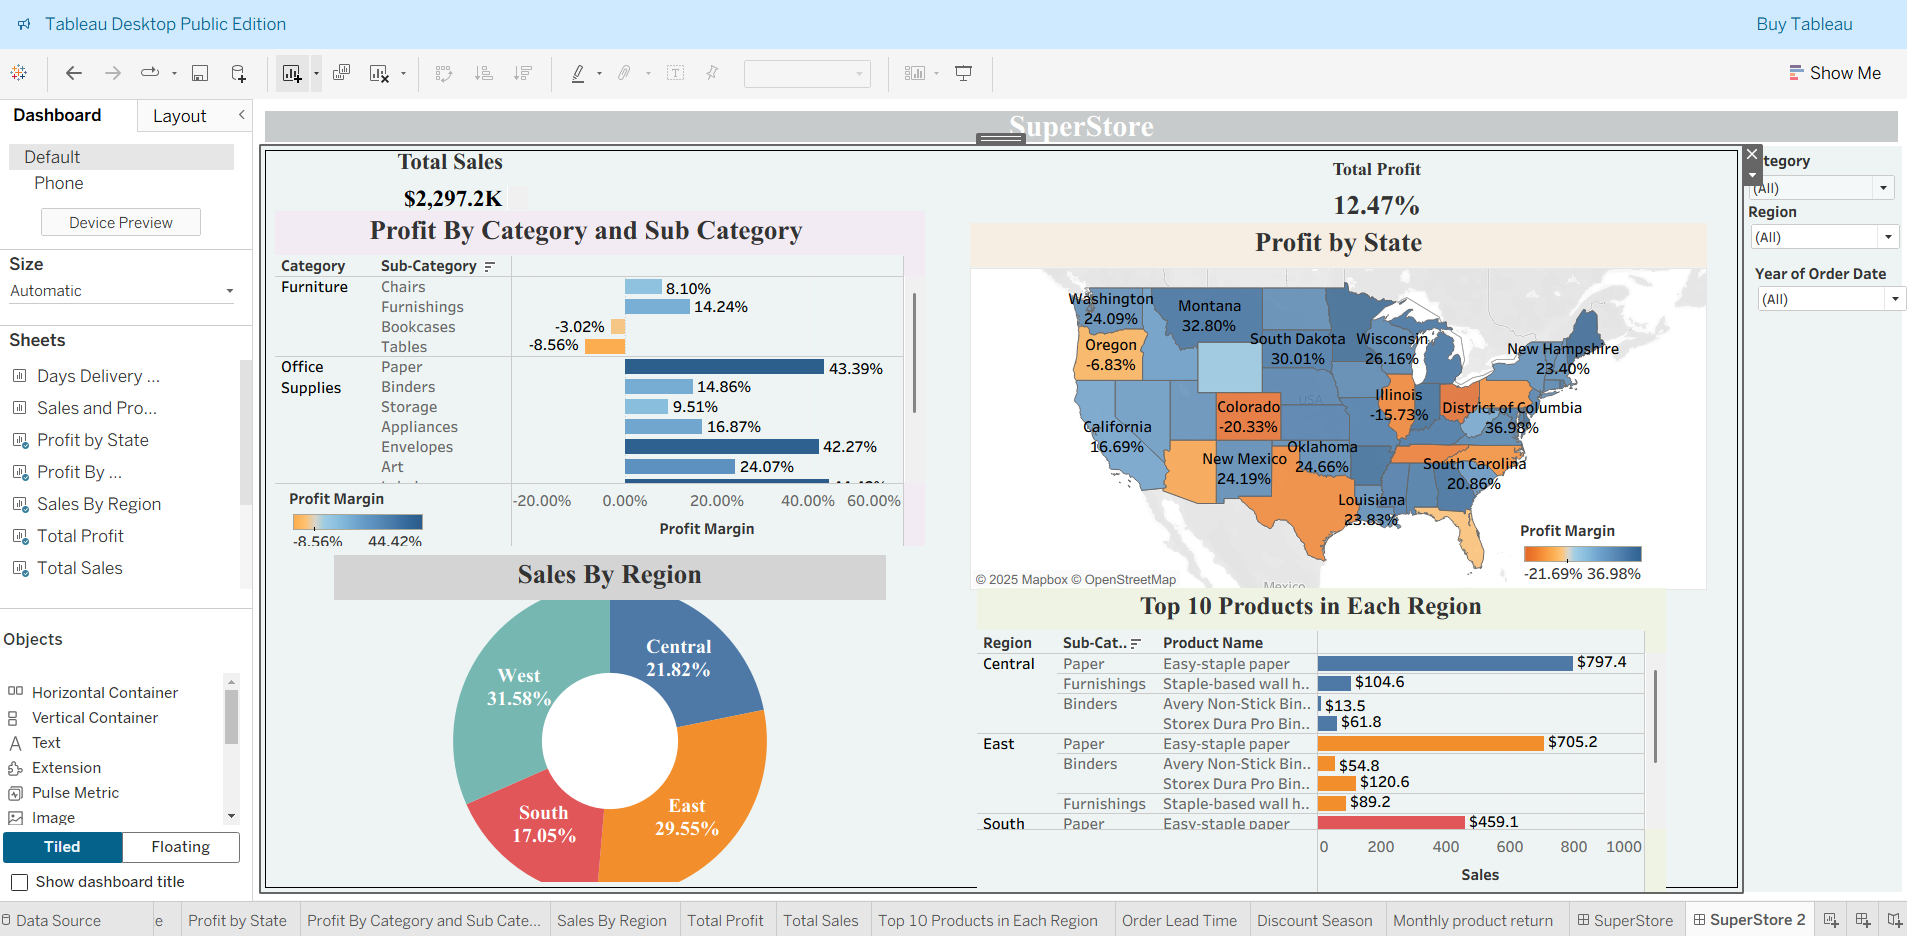
An interactive business dashboard for the popular Superstore dataset, built with Tableau. Explore regional sales, profit trends, category breakdowns, and key KPIs through dynamic maps and charts. Two linked dashboards provide actionable insights for managers and analysts.
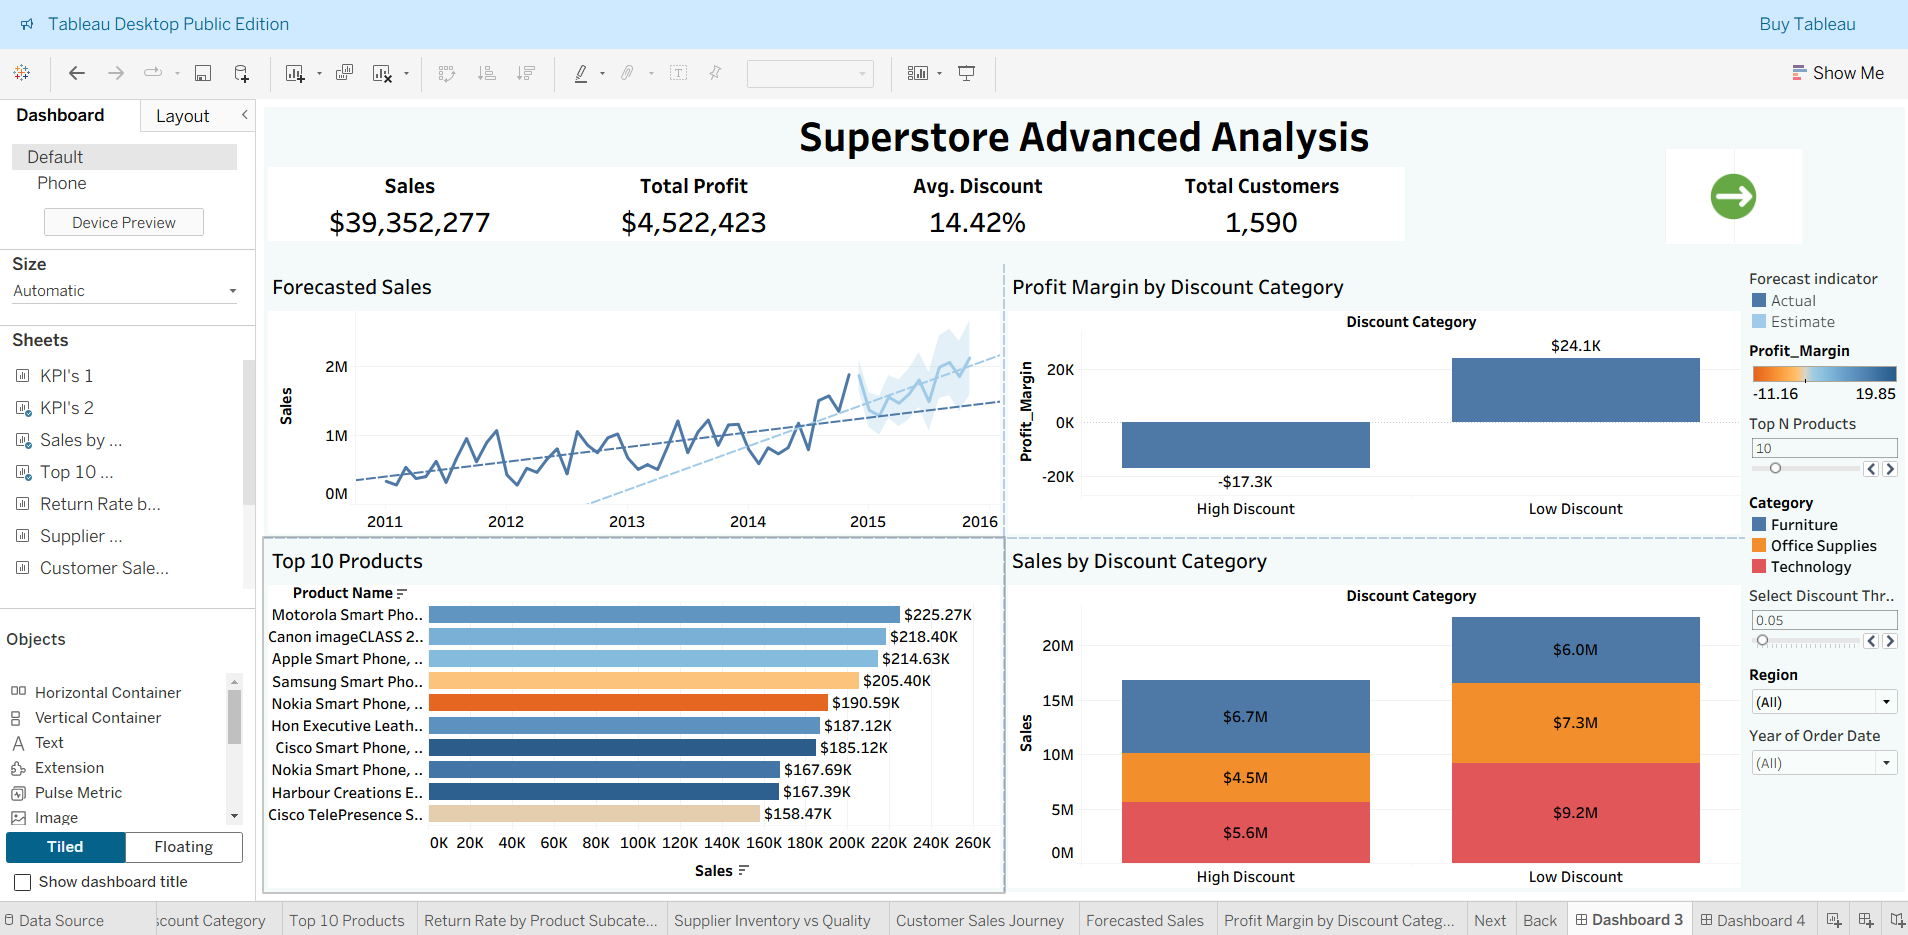
View Details10. Global Superstore Analysis (Tableau)
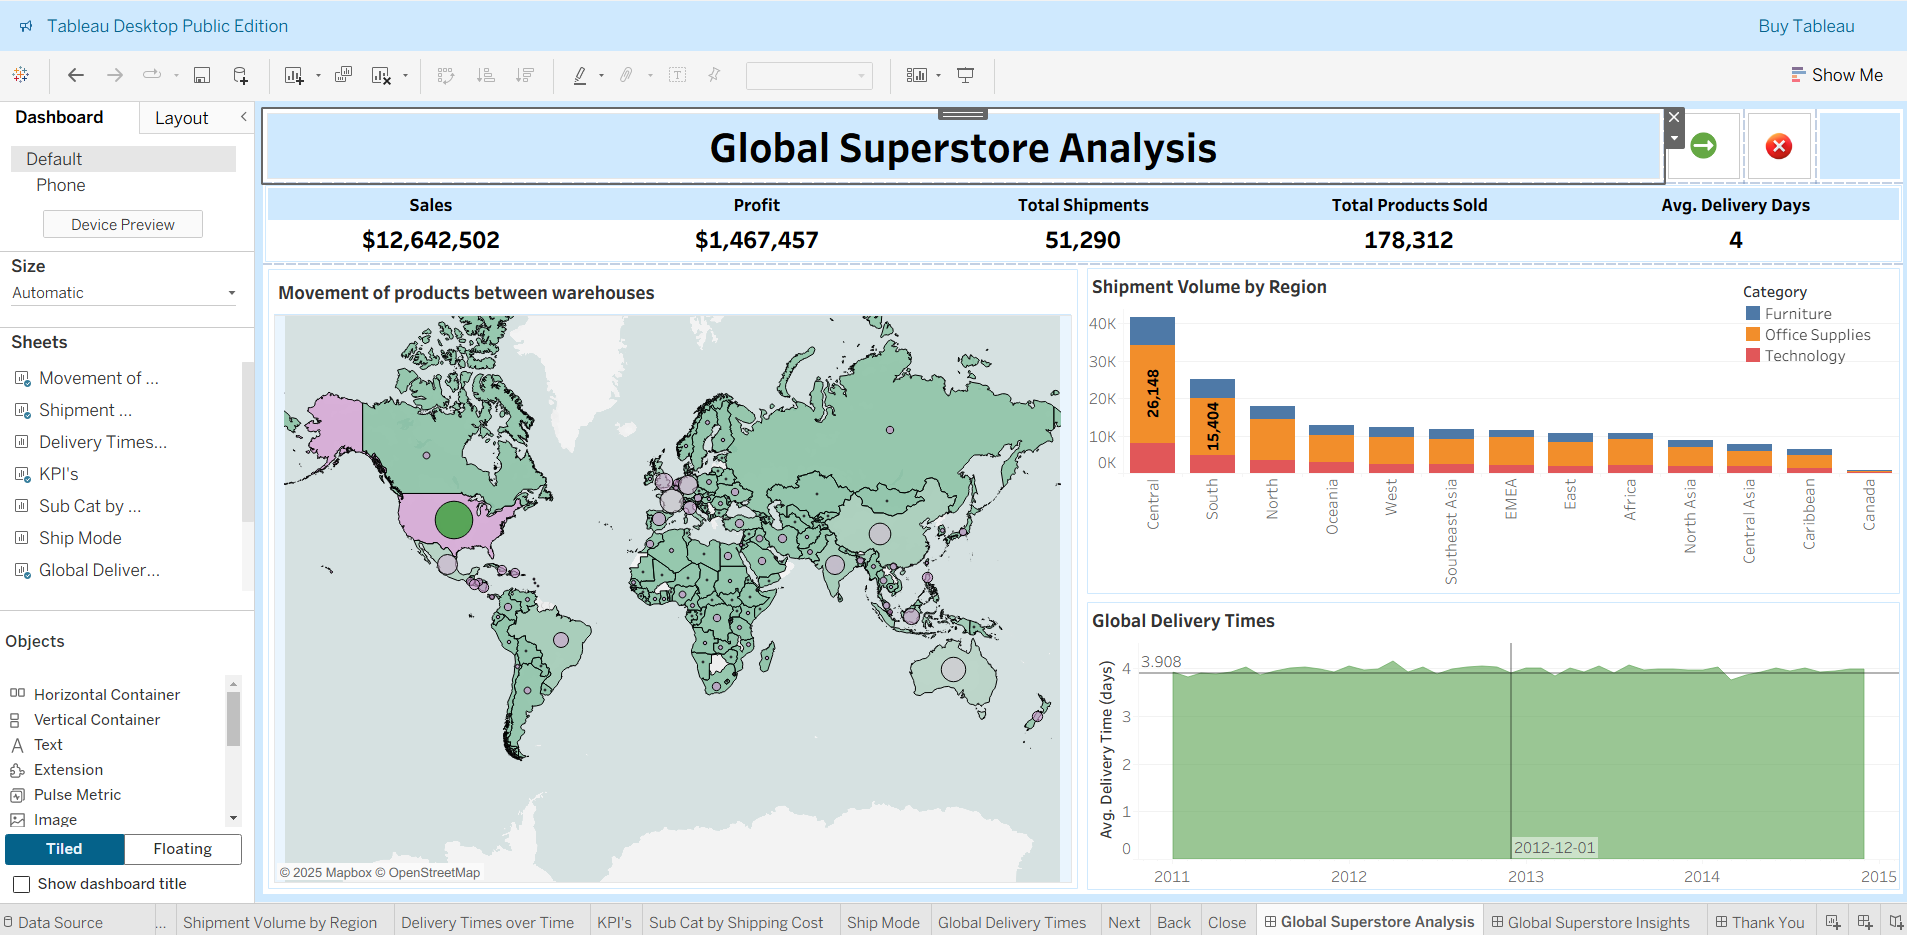
Advanced Tableau dashboards analyzing global sales, profits, customer segments, and trends in the Global Superstore dataset. Features regional performance, category analysis, and interactive insights for strategic business decisions.
View Details11. Global Orders & Profit Dashboard (Tableau)
Dual Tableau dashboards exploring global orders, profitability, shipping performance, and key metrics. Features interactive KPIs, geographic analysis, and data-driven insights for decision makers.
View Details12. Global Trade Analytics (Python & Tableau)
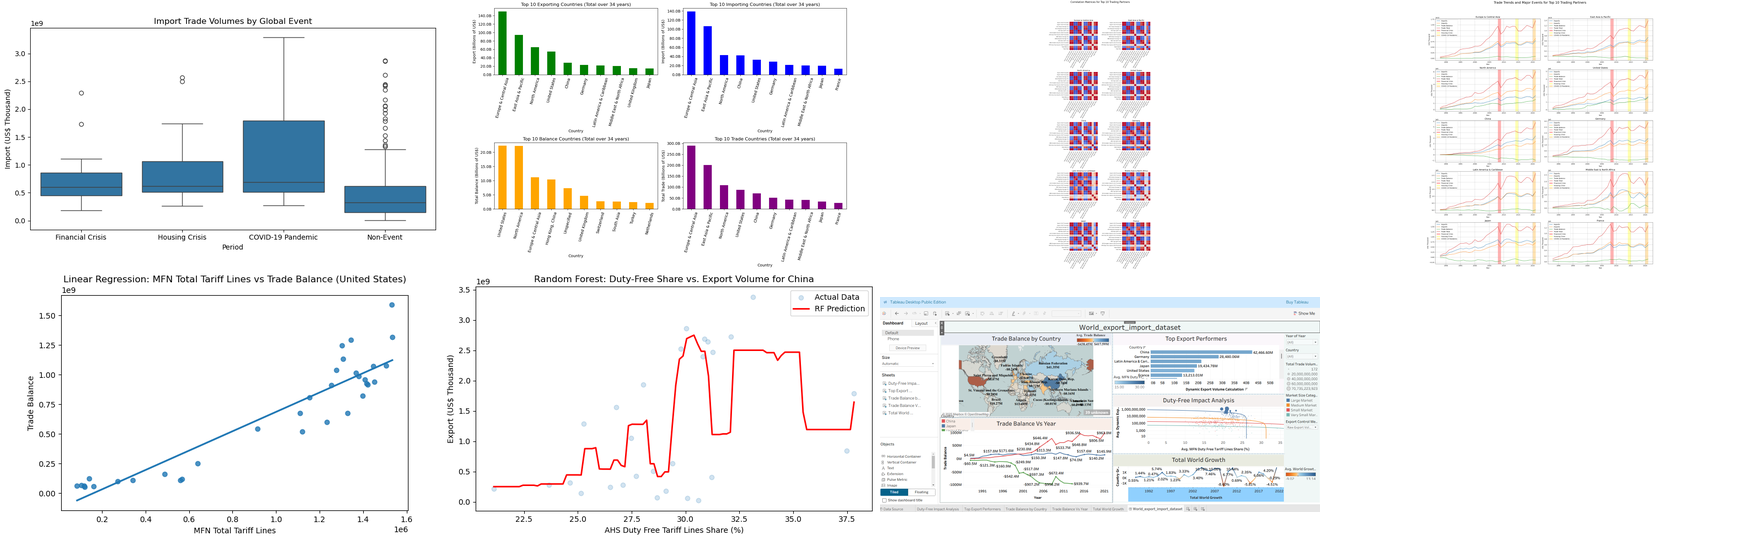
End-to-end analysis of 34 years of global trade, tariffs, and economic disruptions using Python (EDA, regression, Random Forest) and Tableau (interactive dashboards, world maps). Hypothesis-driven insights for policymakers and business leaders.
View DetailsOther Interesting Projects
1. LR Presets Catalog (AI-Native · In Progress)

Lightroom preset catalog built with Claude Code. Custom trilingual i18n (ES/EN/FR) from scratch, Python image pipeline (Pillow, OpenCV, NumPy) for split previews, Chart.js tone-curve analytics, and Canvas 2D histogram comparison — all static, deployed on GitHub Pages.
Tools: Python, Pillow, OpenCV, Chart.js, Vanilla JS, GitHub Pages, Claude Code
View Details2. Bicycle Store (SQL Analysis)
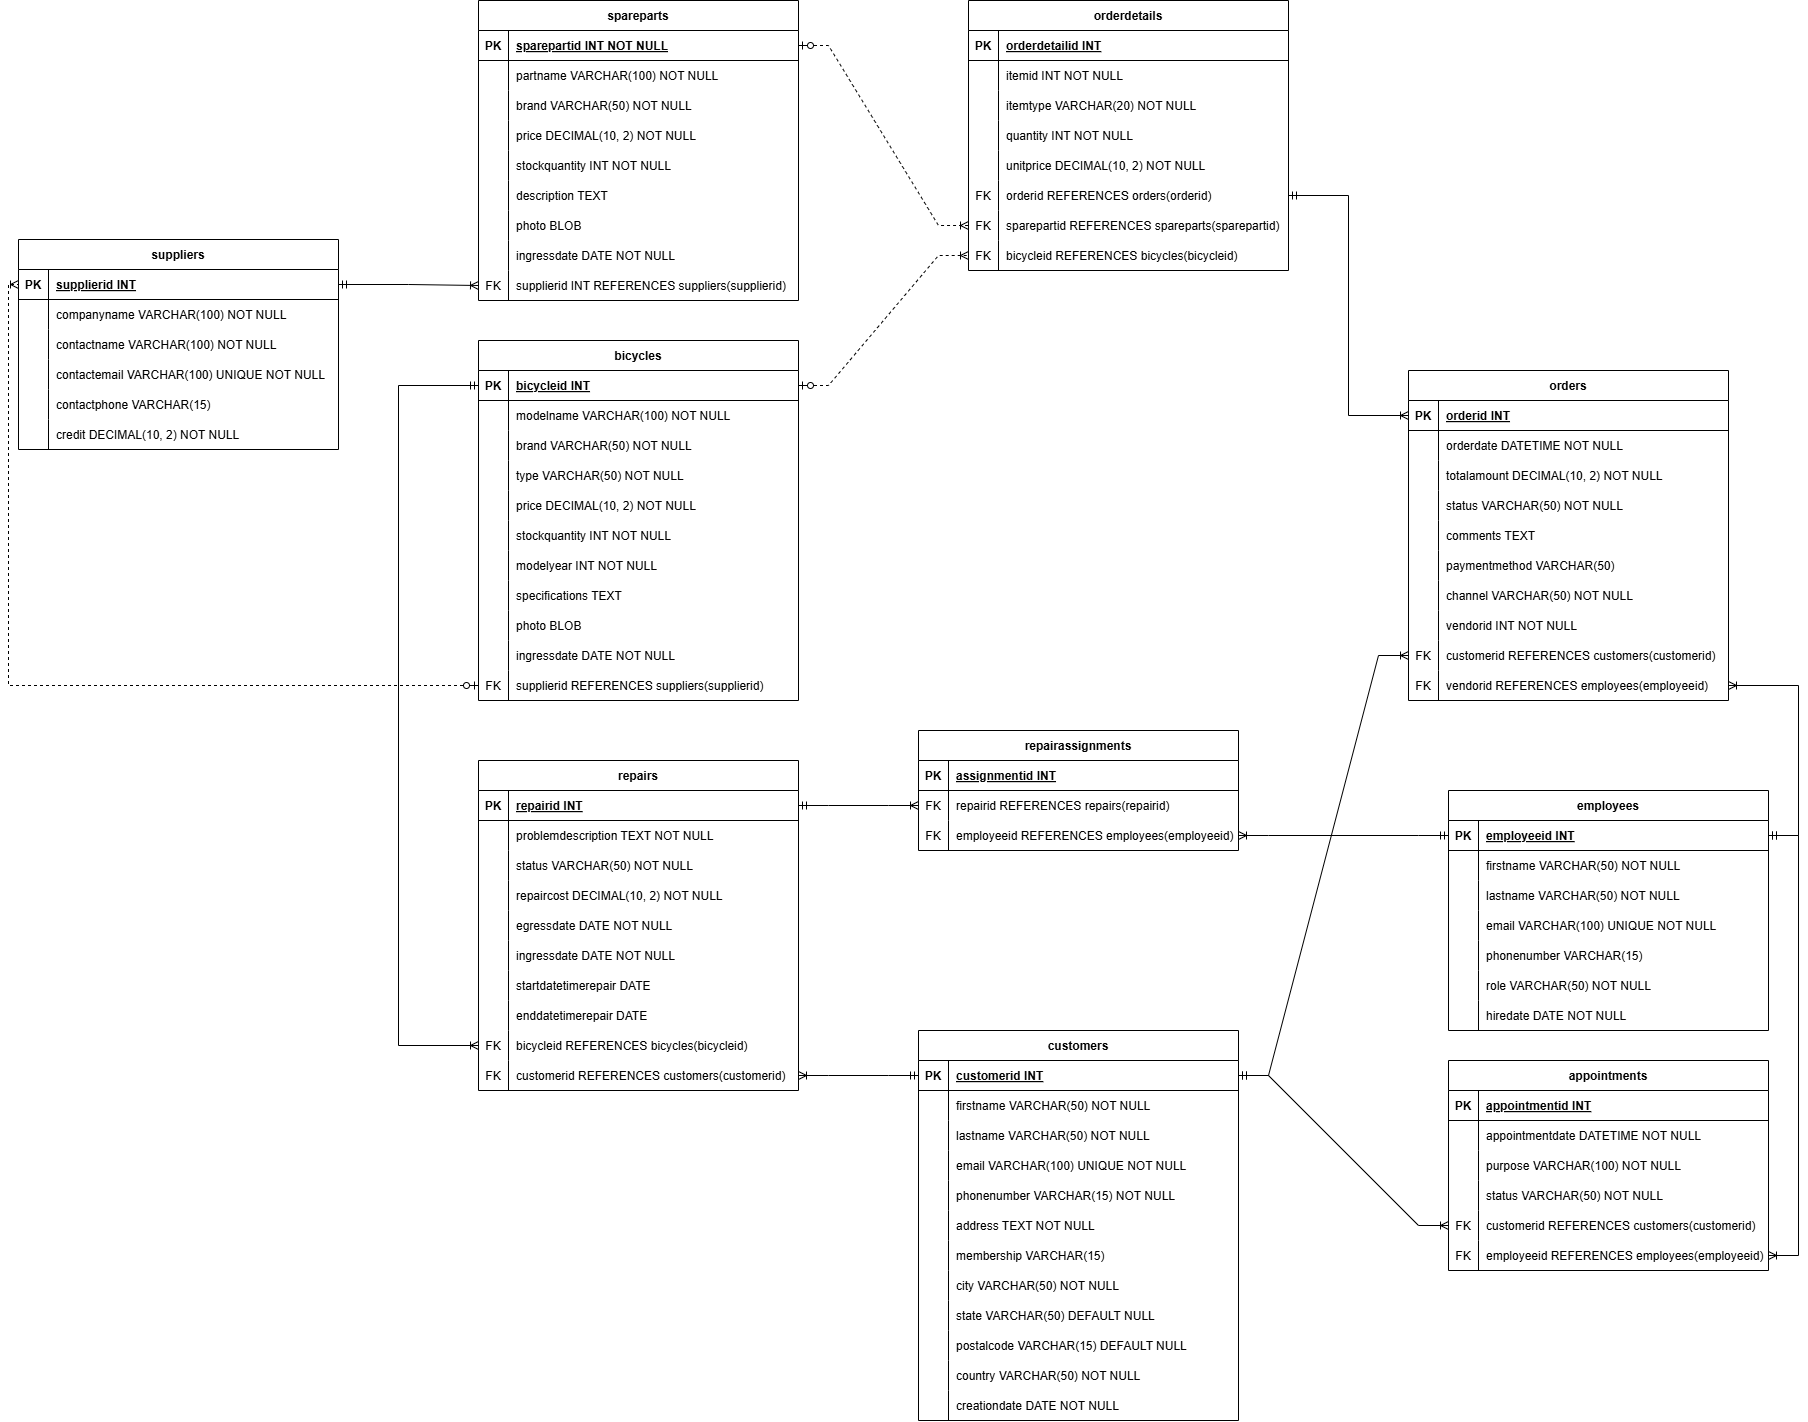
Database modelling and SQL analysis for a retail bicycle store.
View Details3. Bus Scheduling Optimization (Python)
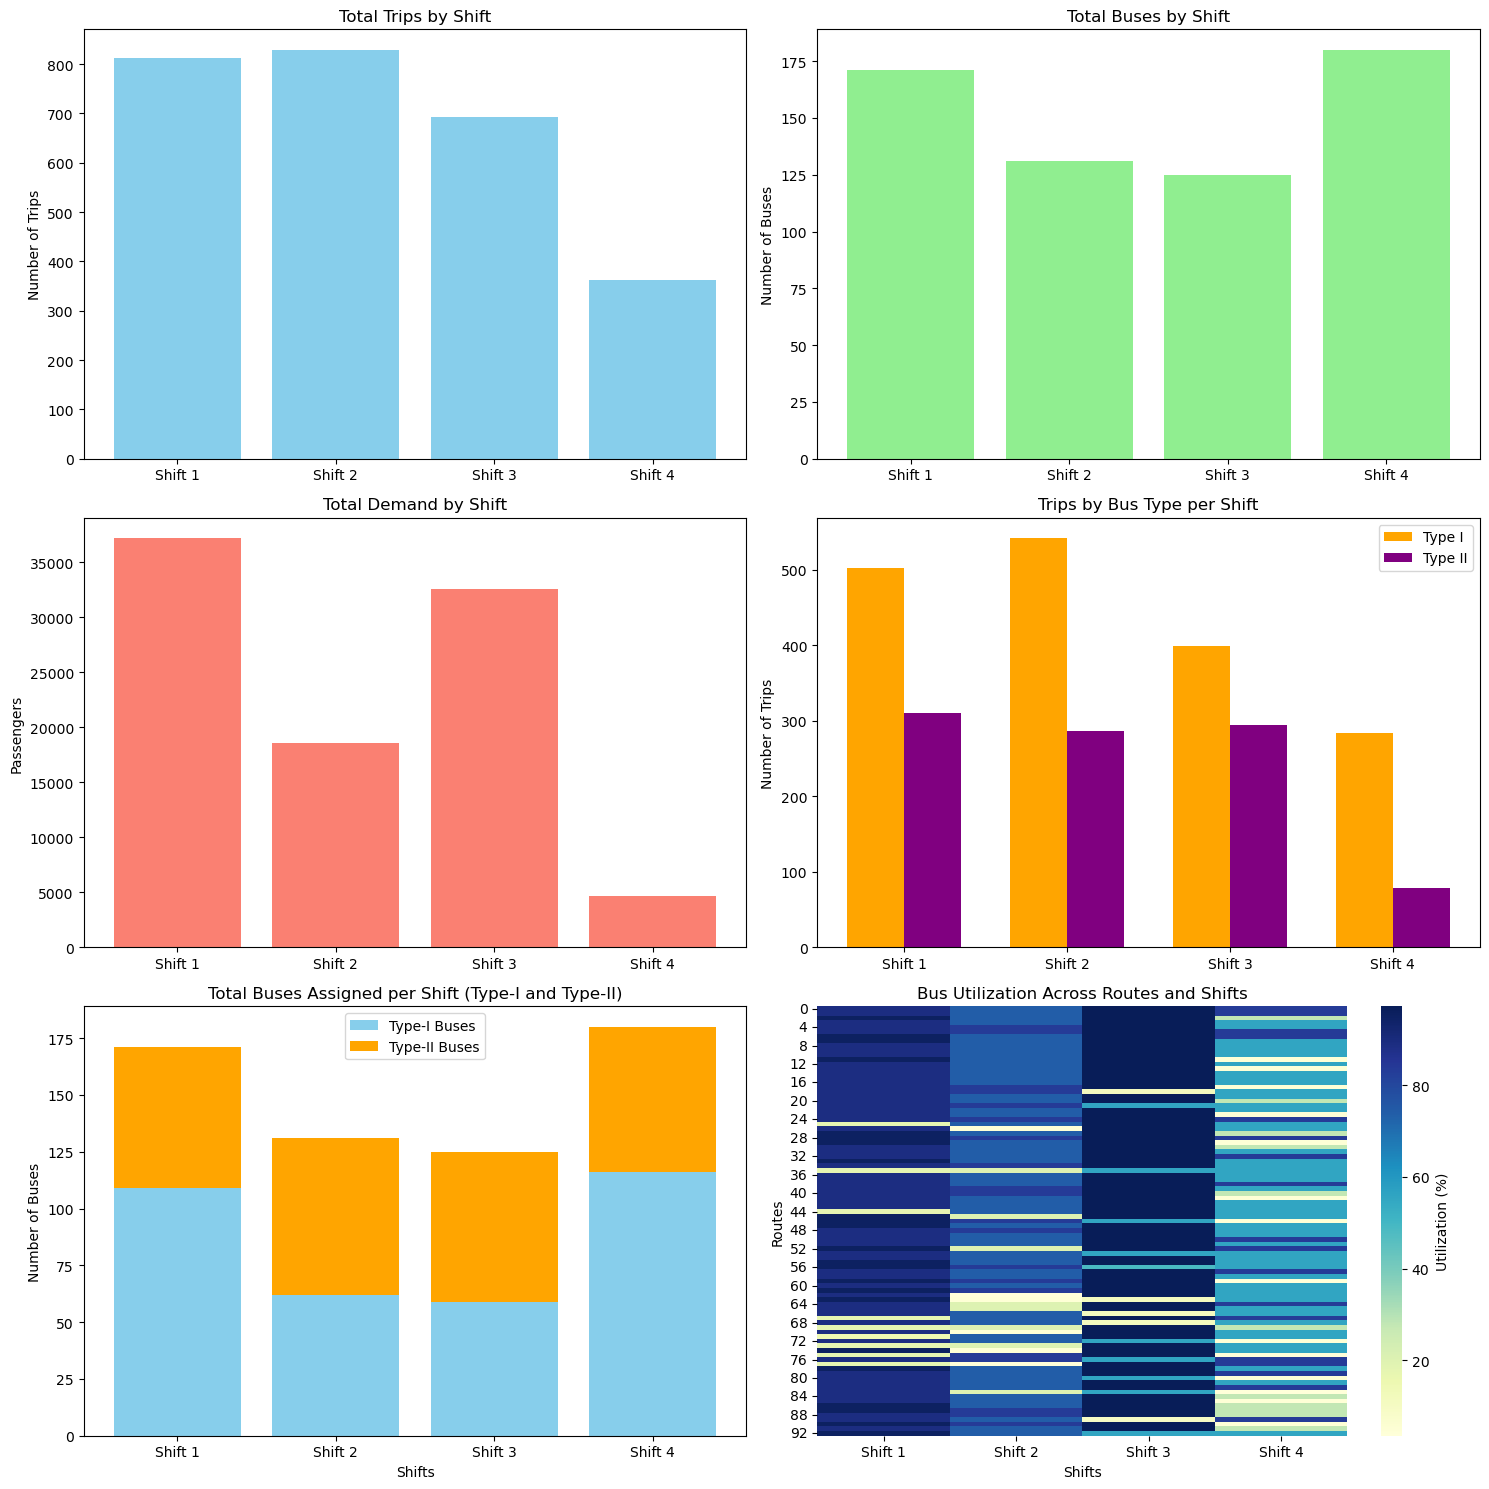
Optimization of bus resources for urban public transportation using LP and advanced modelling using Python Solvers.
View Details4. Sales Modeling & DAX (Power BI)
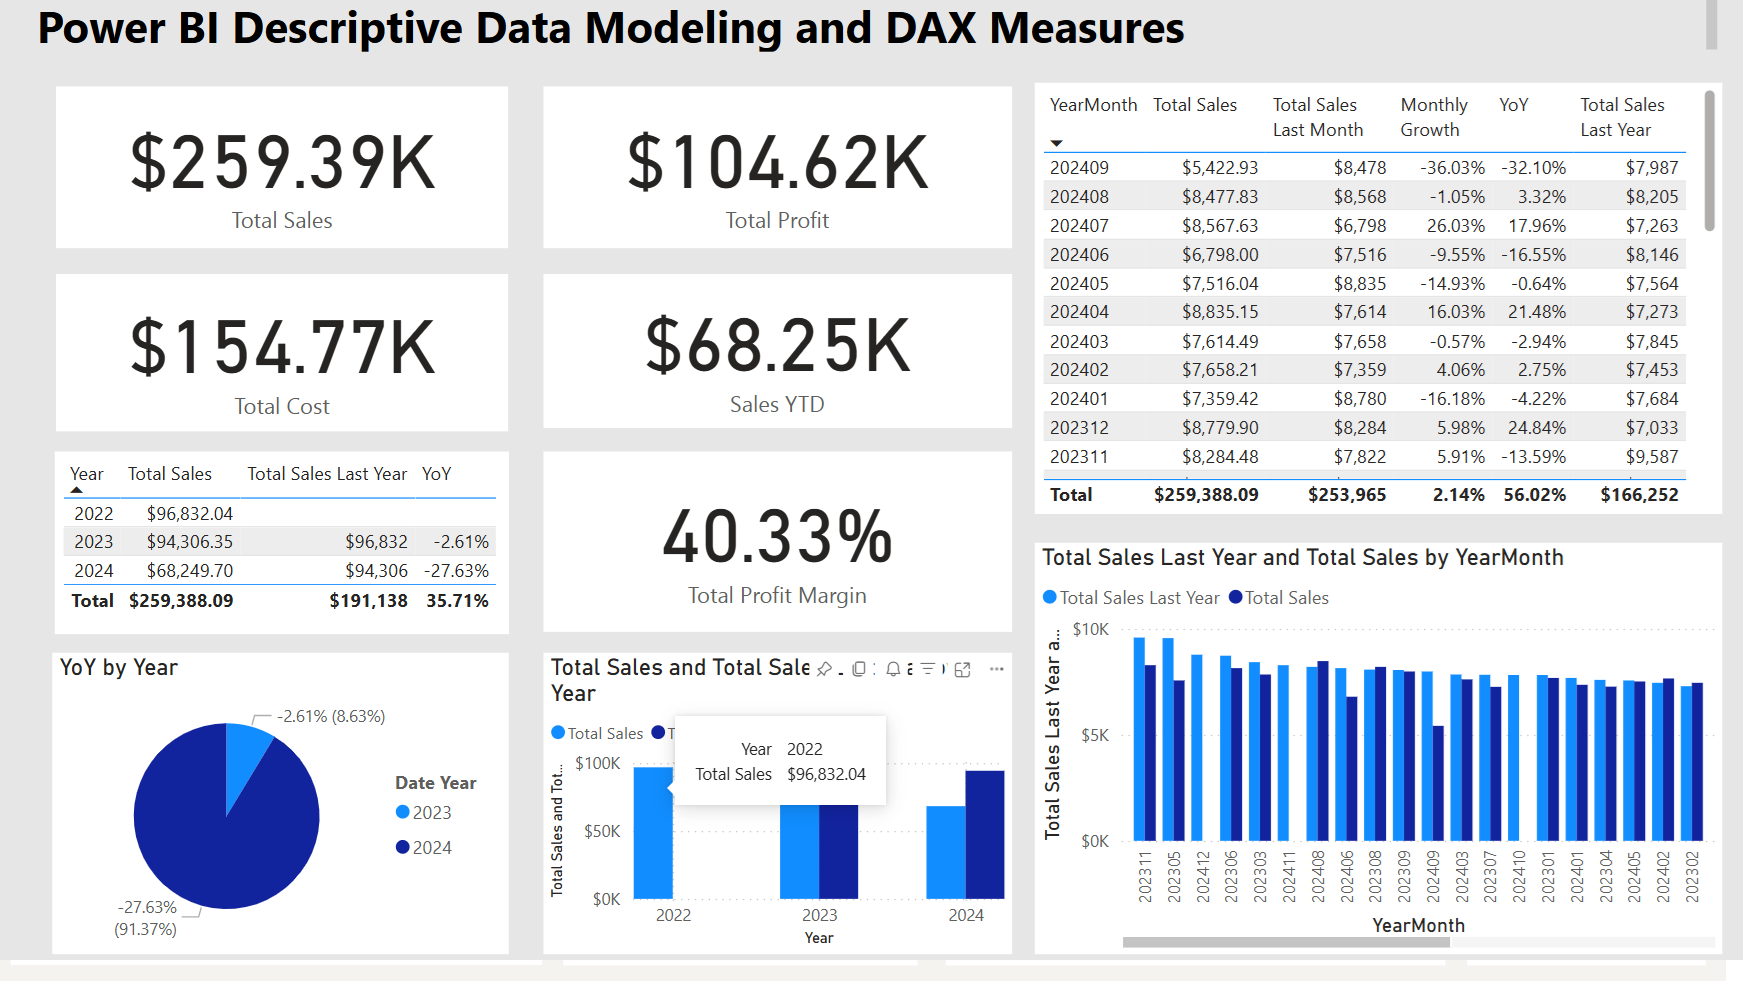
Descriptive analysis of sales data using Power BI and advanced DAX measures.
View Details5. Iris Dataset Analysis (Python + Power BI)
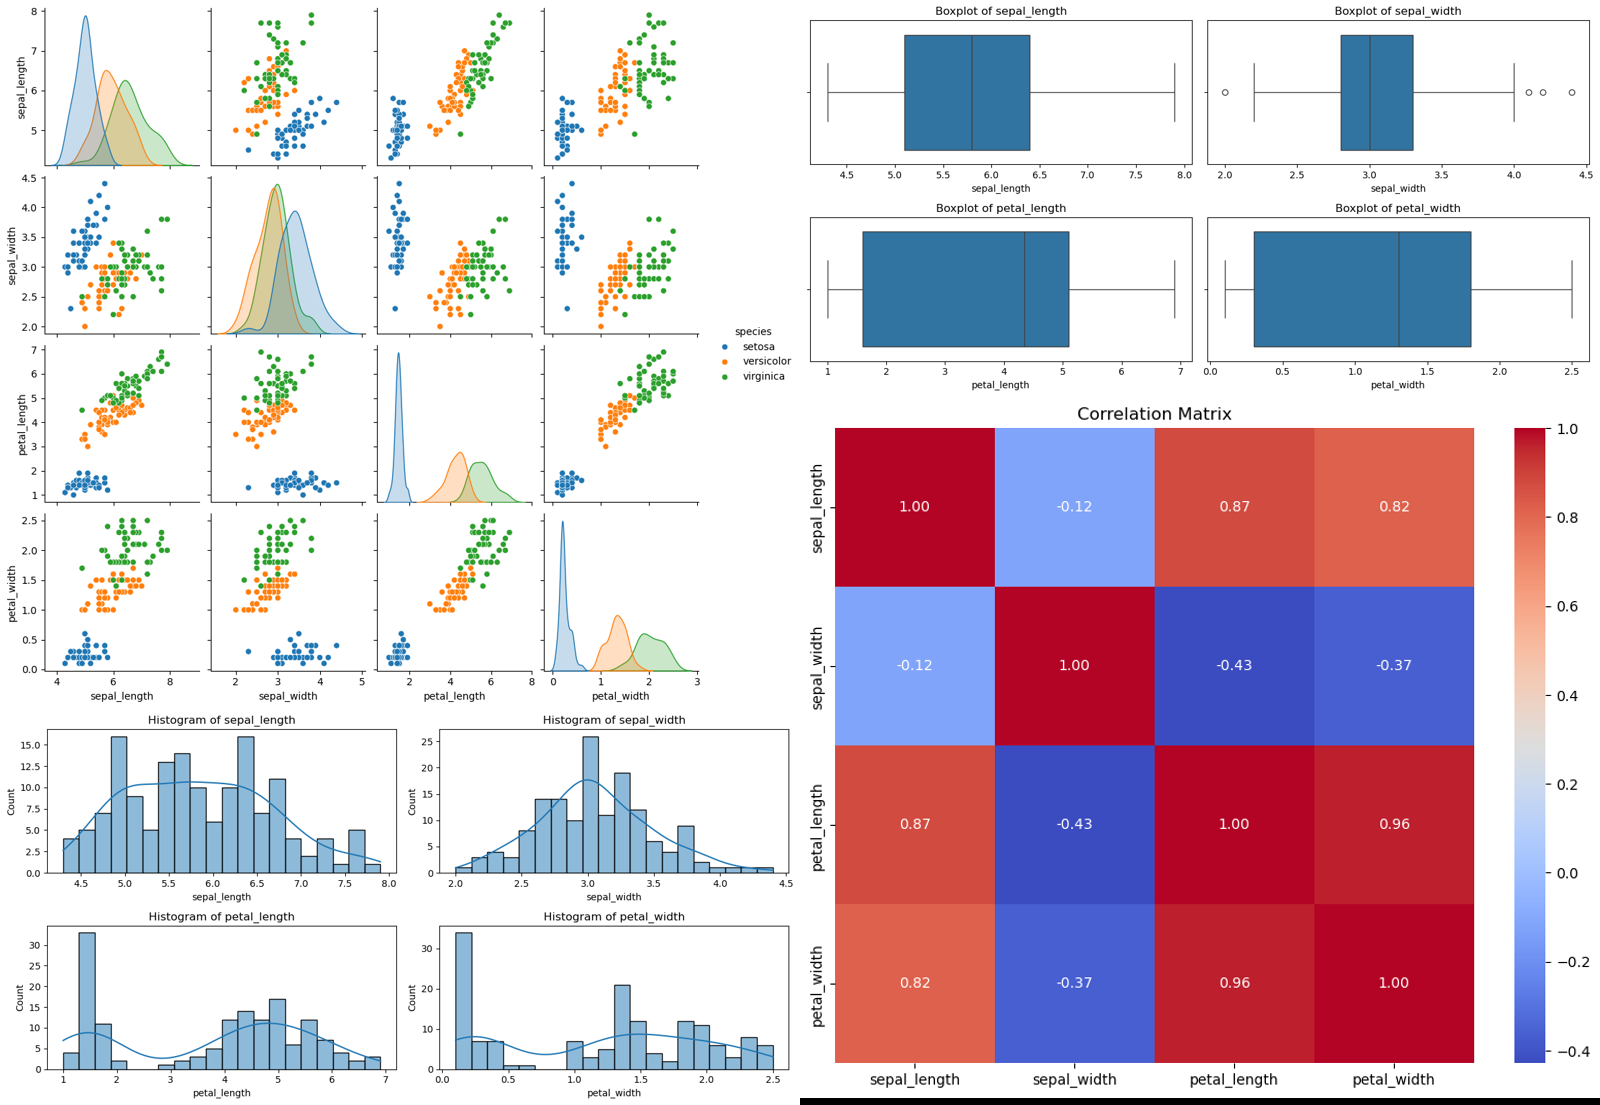
Data exploration of the Iris dataset using Python preprocessing and Power BI dashboards.
View Details6. Housing Prices & Bike Sharing (Python + Power BI)
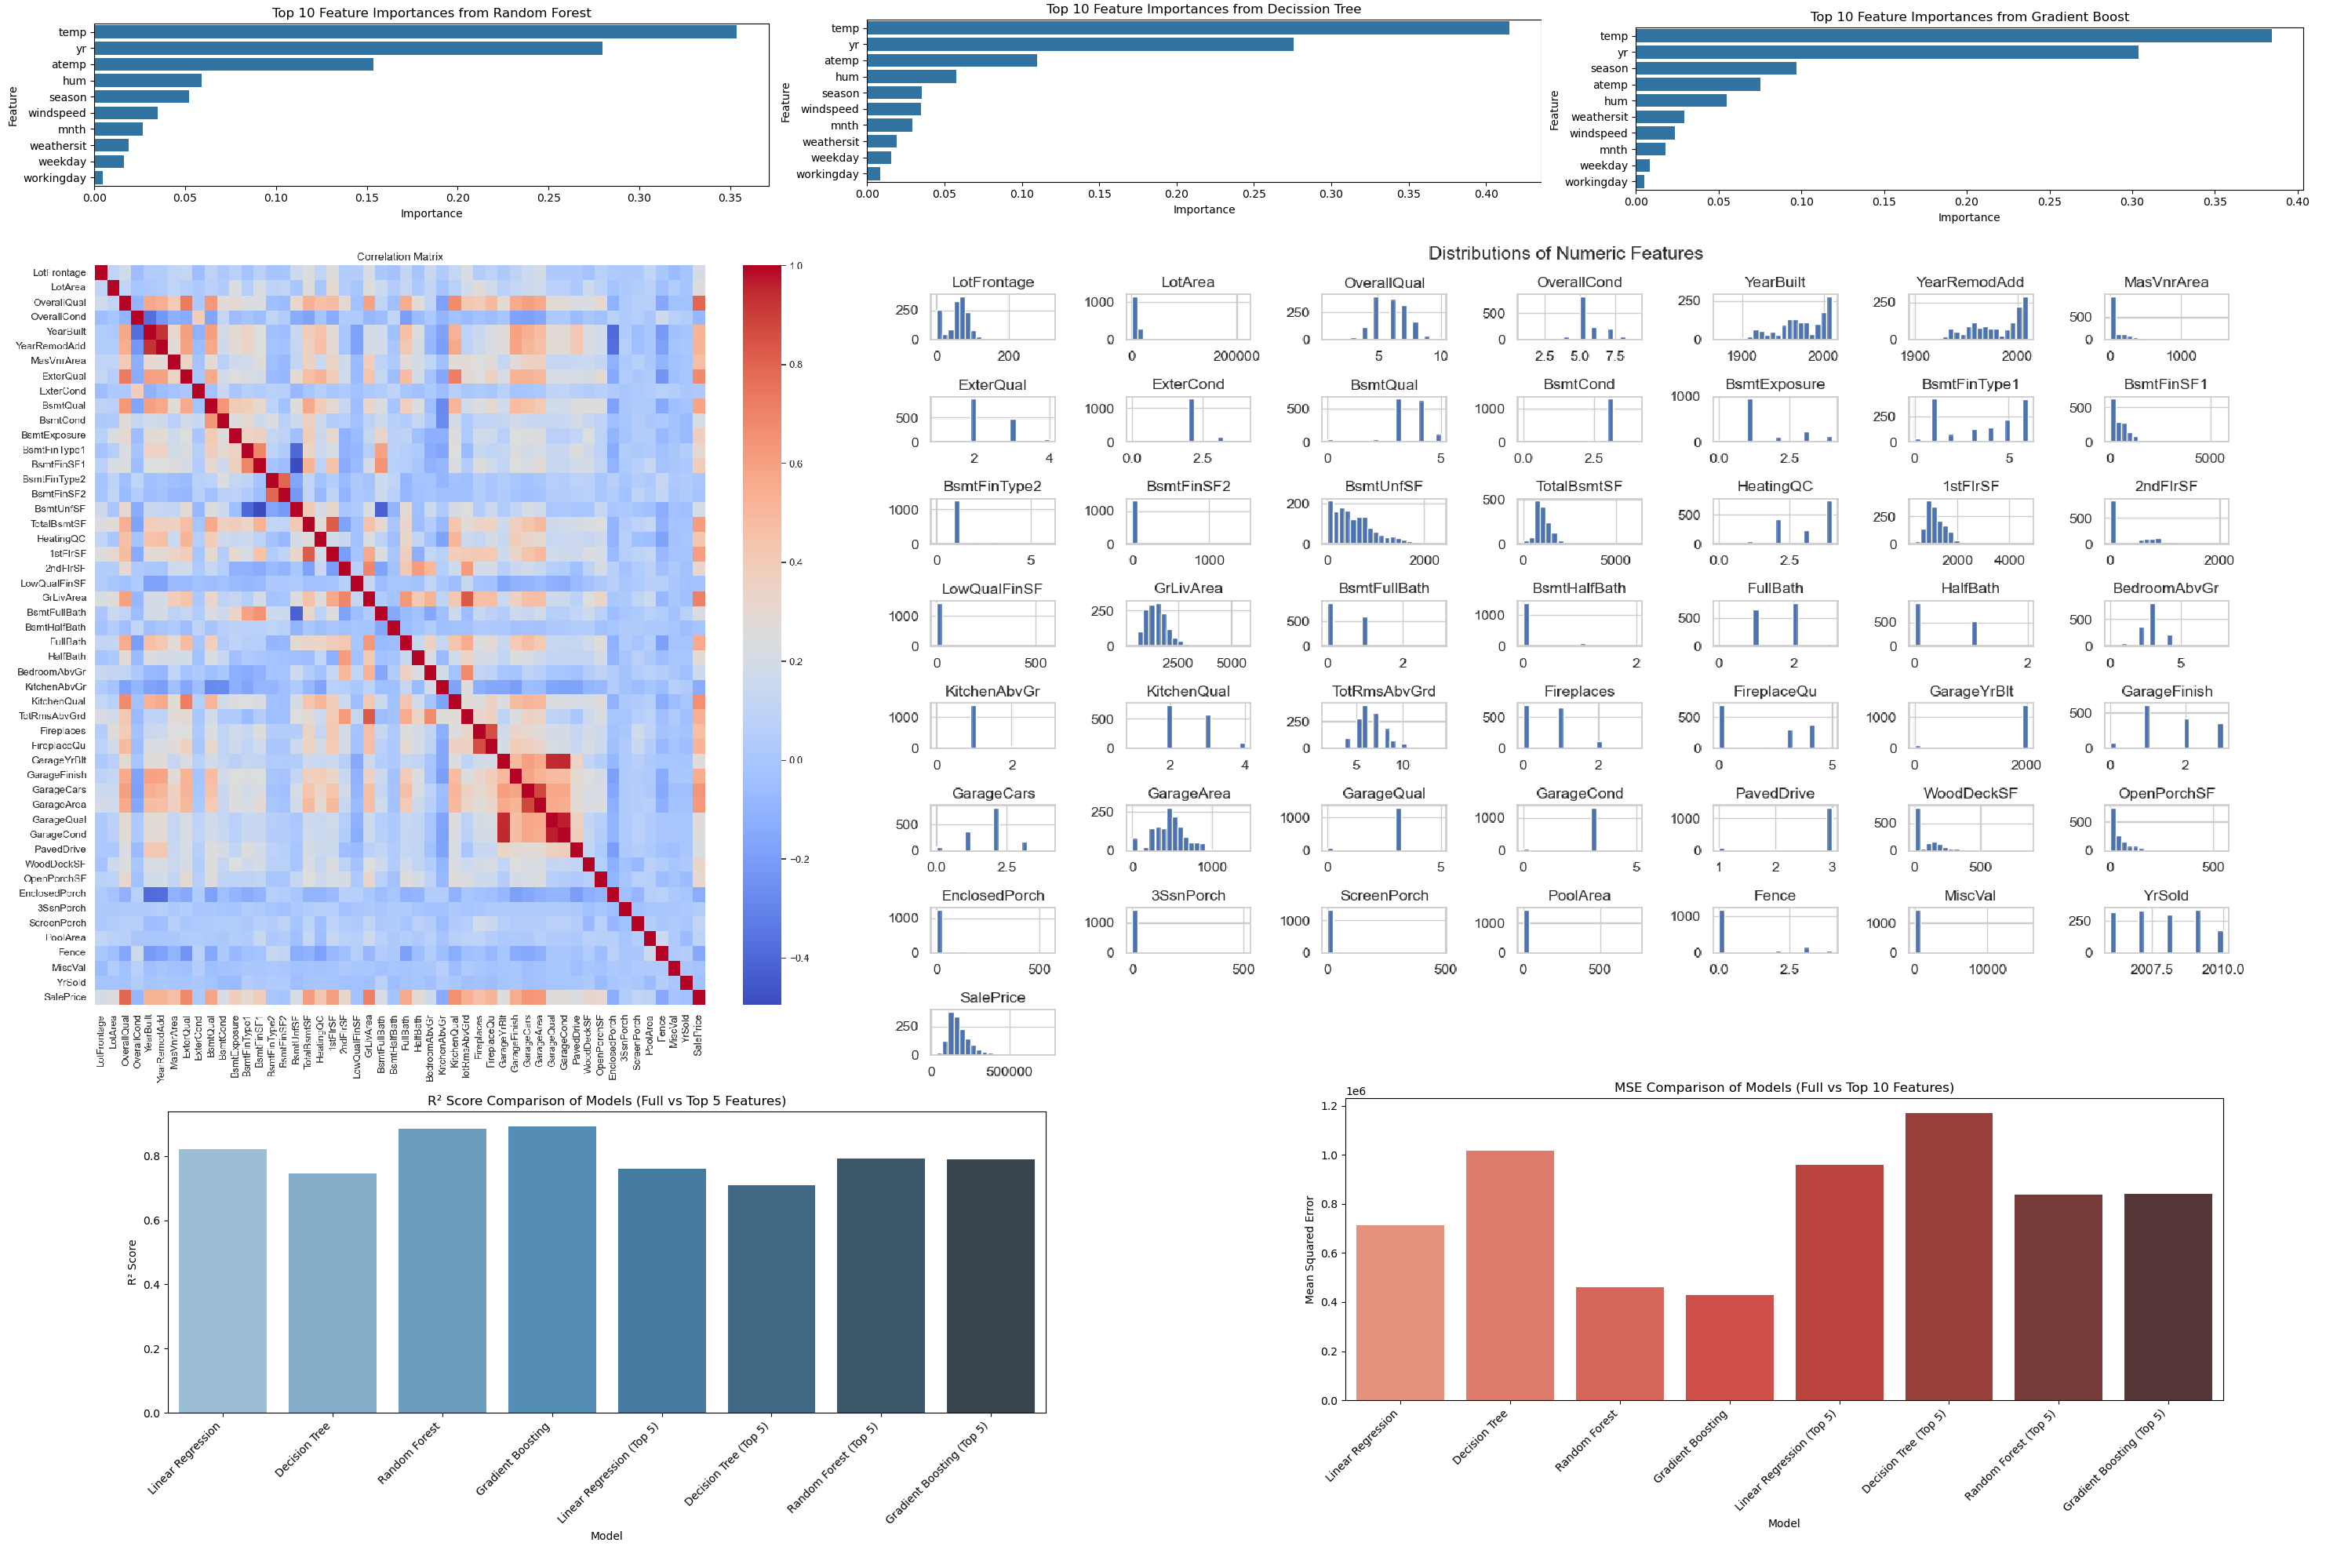
End-to-end workflow using Python notebooks for preparation and prediction, paired with Power BI dashboards for housing prices and bike sharing.
View Details7. Advanced Visualizations & Insights (Tableau)
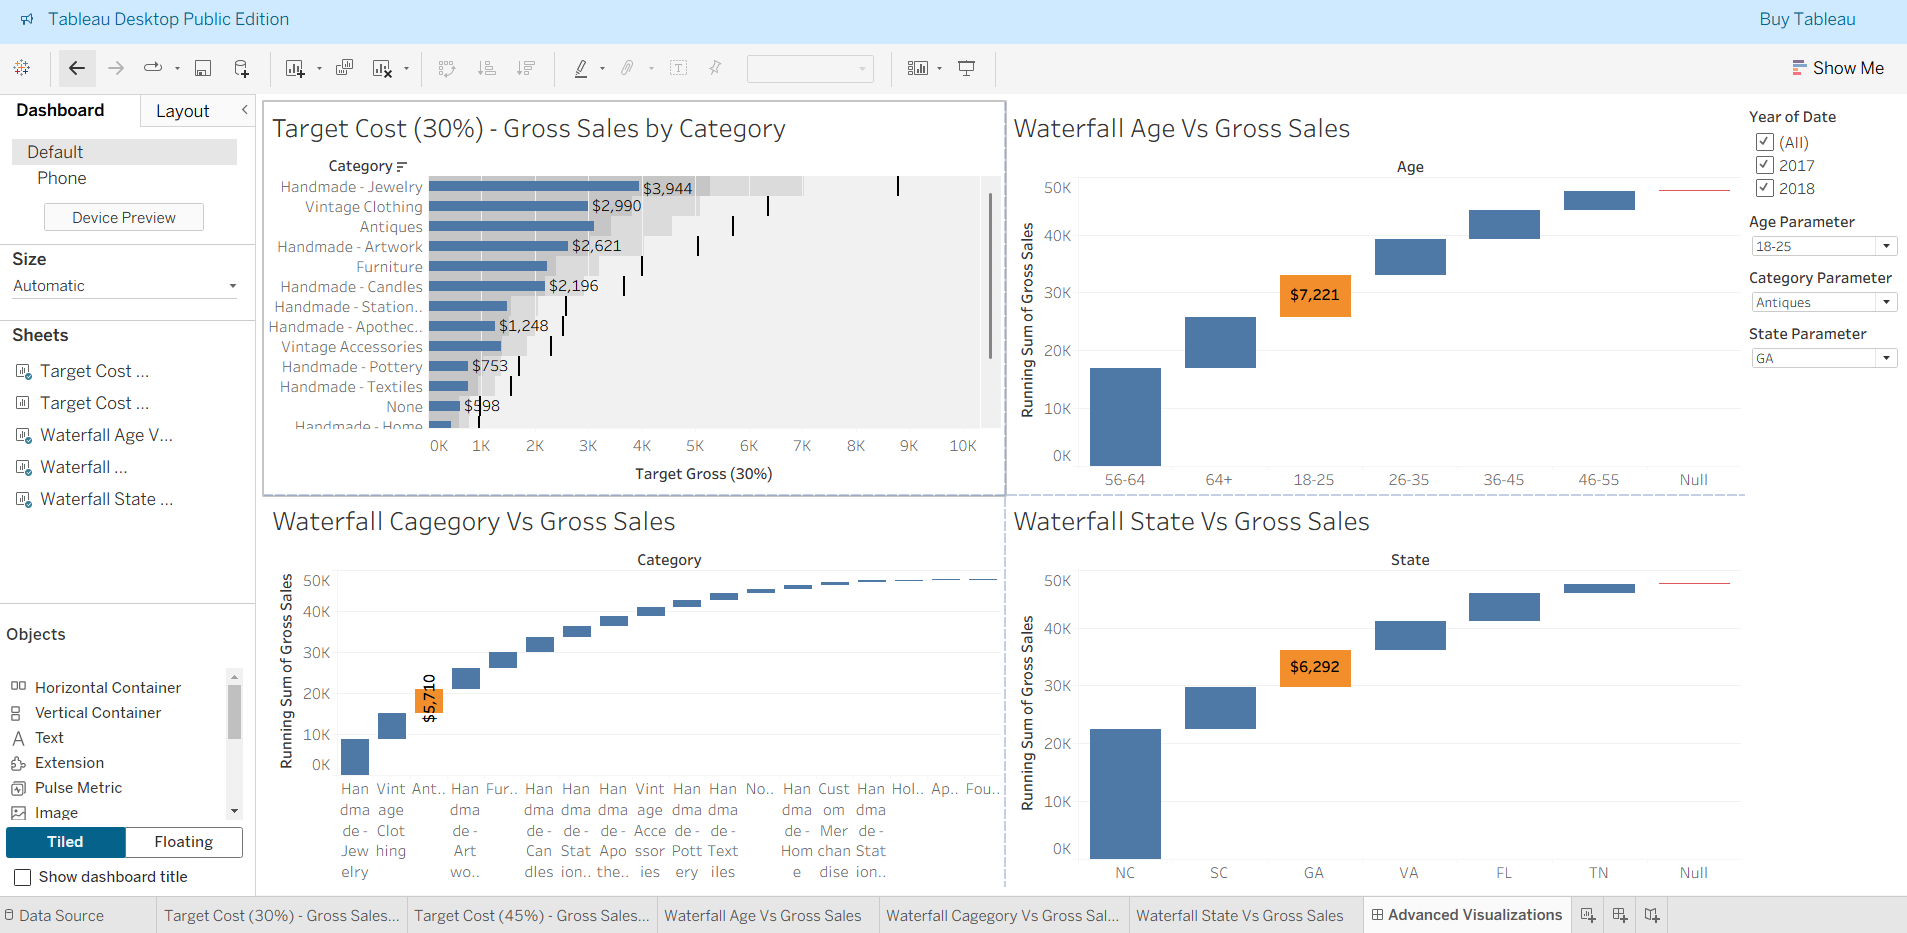
A Tableau dashboard showcasing advanced visualizations for multi-dimensional data analysis. Combines interactive filters, dynamic charts, and spatial analysis for deeper business insights and discovery.
View Details8. Heart Attack Risk Dashboard (Tableau)
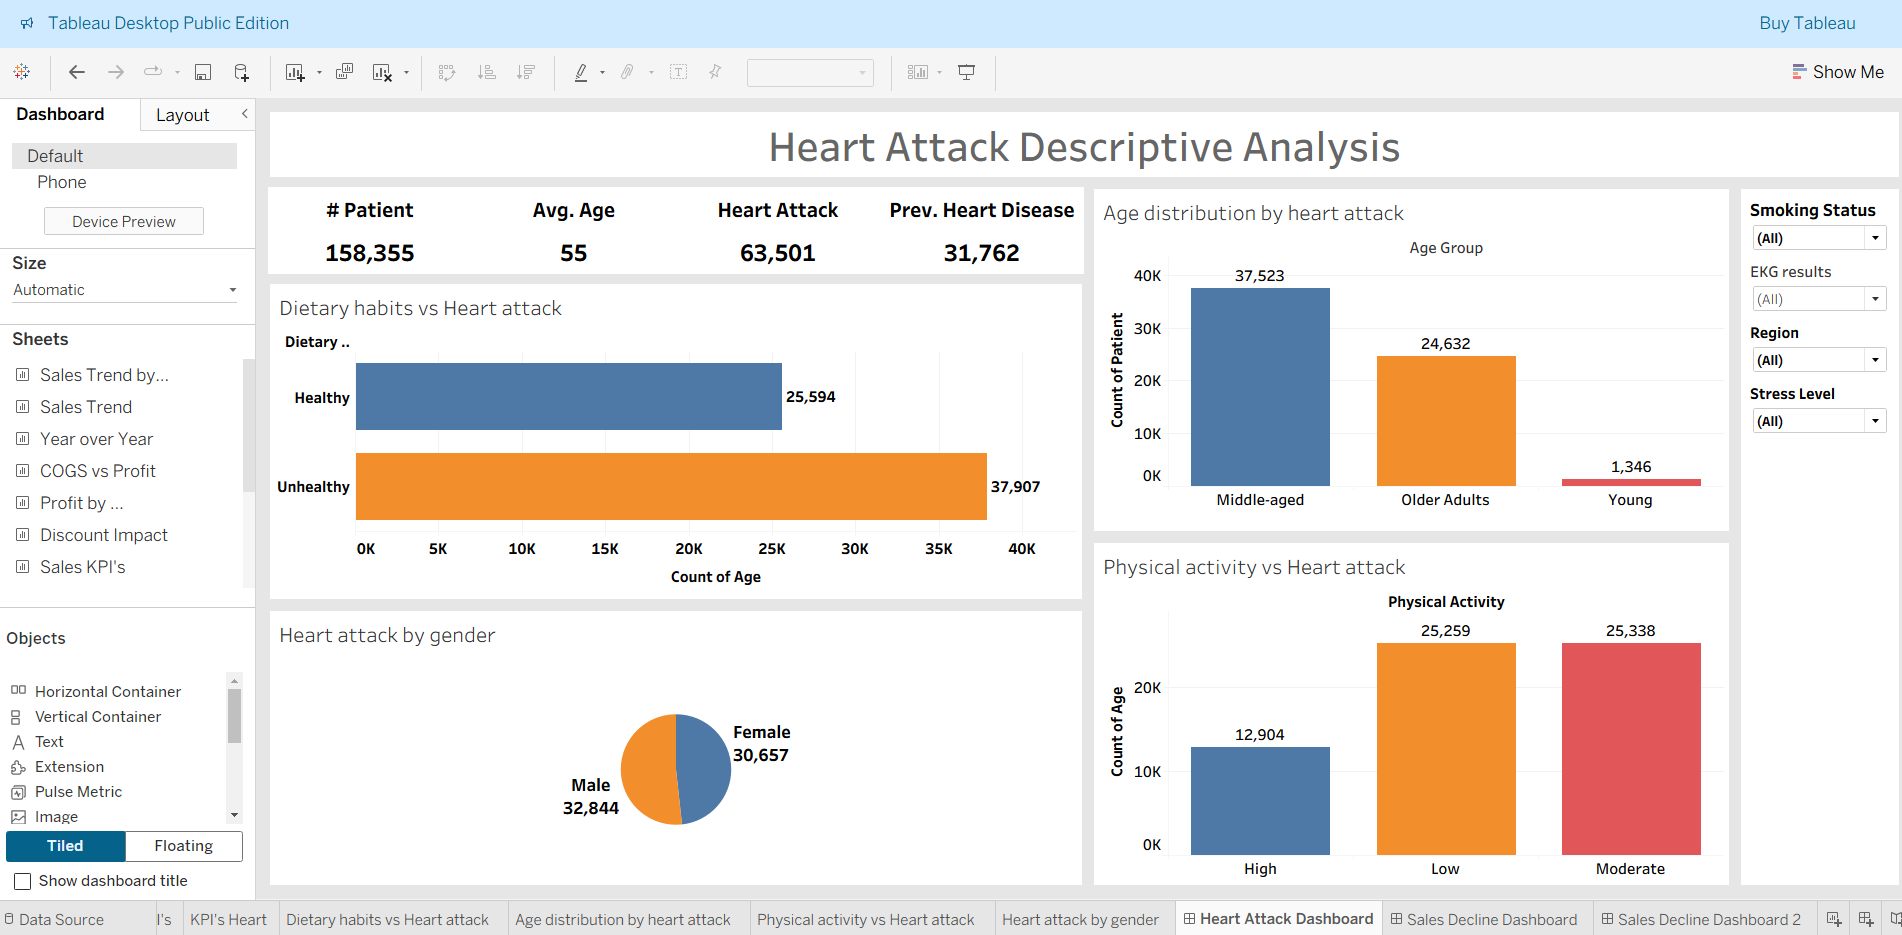
Tableau dashboard analyzing heart attack risk factors and patient profiles. Includes interactive filters, risk segmentation, and trend analysis for healthcare analytics and preventive care insights.
View Details9. Sales Decline Analysis Dashboard (Tableau)
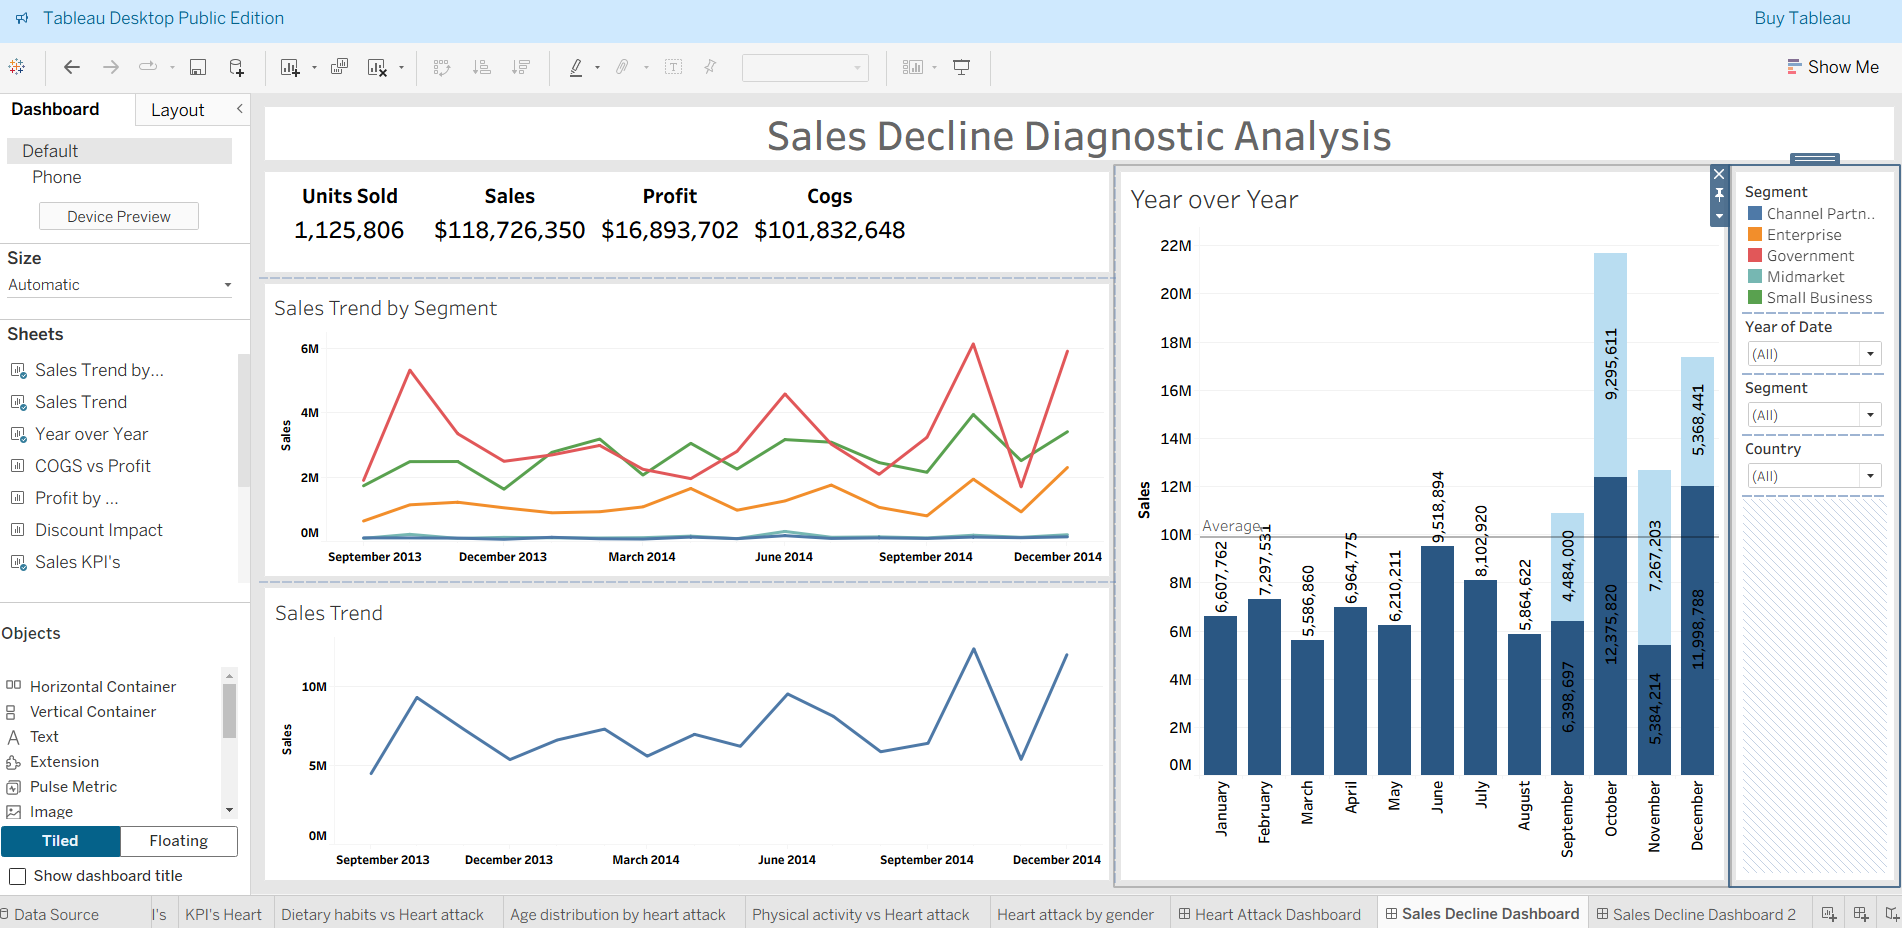
Interactive Tableau dashboards investigating the causes, patterns, and impacts of sales decline. Explore time trends, segment breakdowns, and actionable insights for business recovery and strategy.
View Details