Electric Vehicles Market Analysis
This project analyzes electric vehicle (EV) adoption trends across U.S. states from 2016 to 2023 using Power BI and Python. It explores the influence of government policies, supply chain vulnerabilities, environmental concerns, and infrastructure development.
Tools & Methods
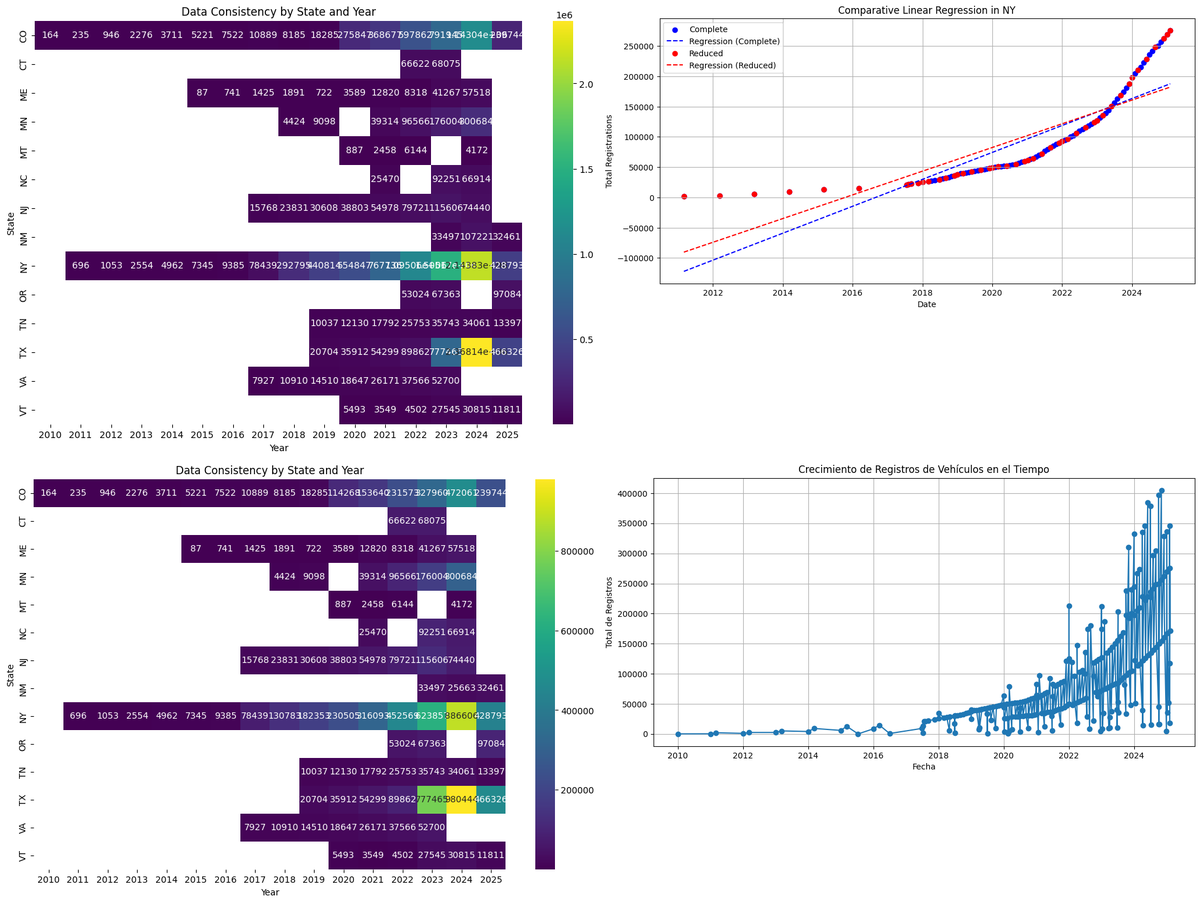
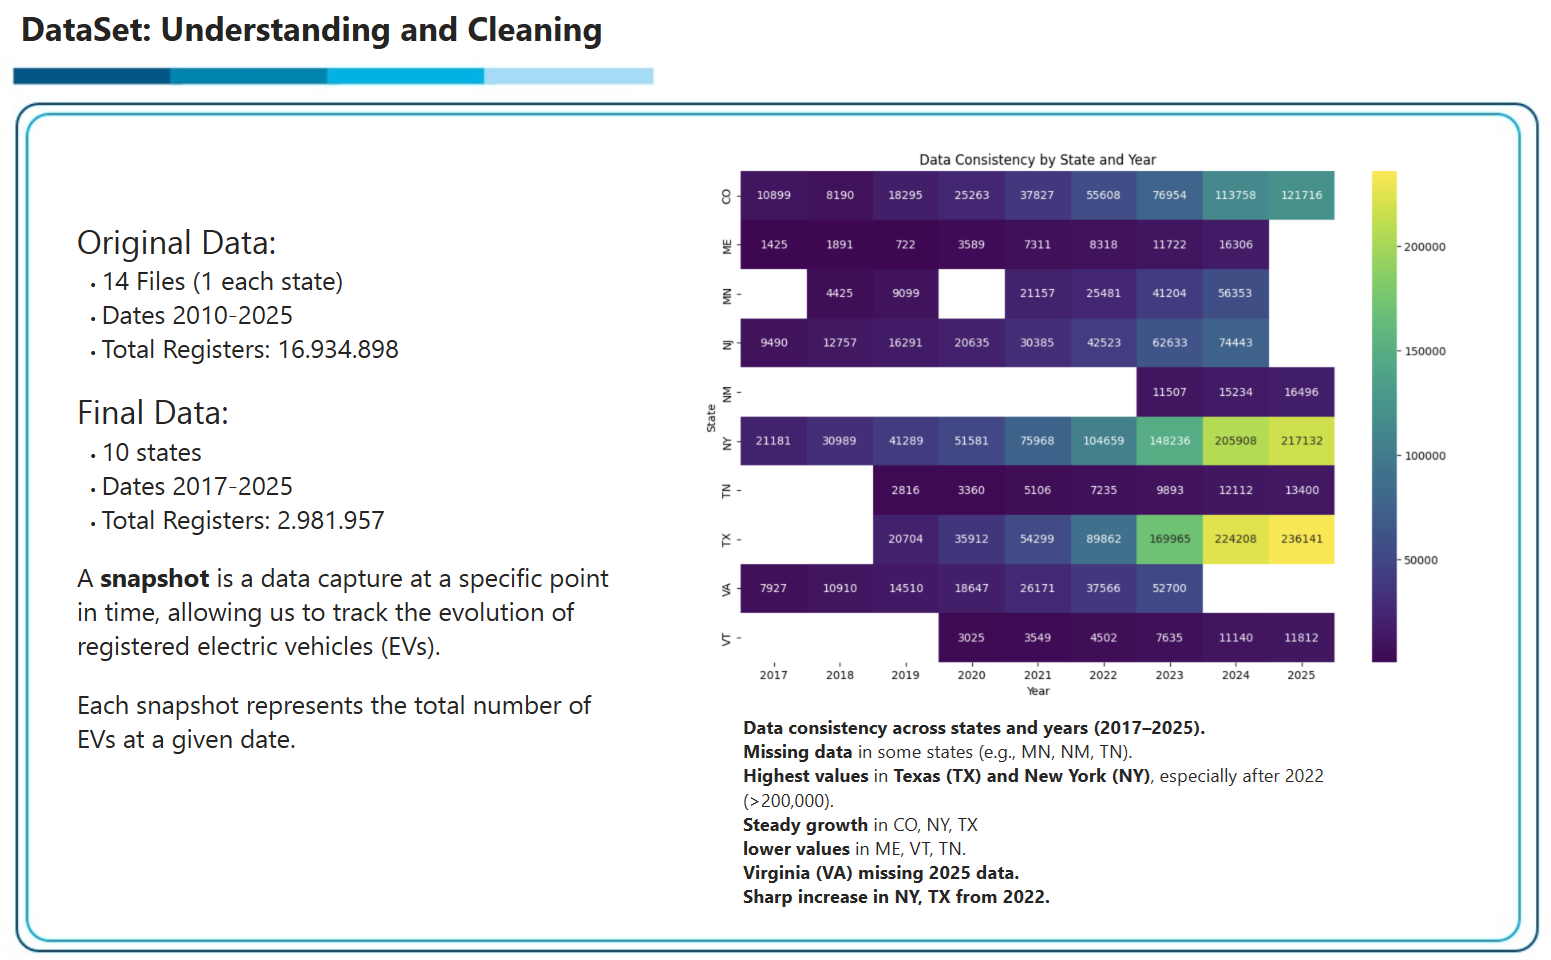
- Data preprocessing in Python (Jupyter Notebooks)
- Data visualization using Power BI
- PESTEL analysis of key EV market drivers
Key Insights
- Government incentives significantly drive EV adoption (e.g., NY and CA)
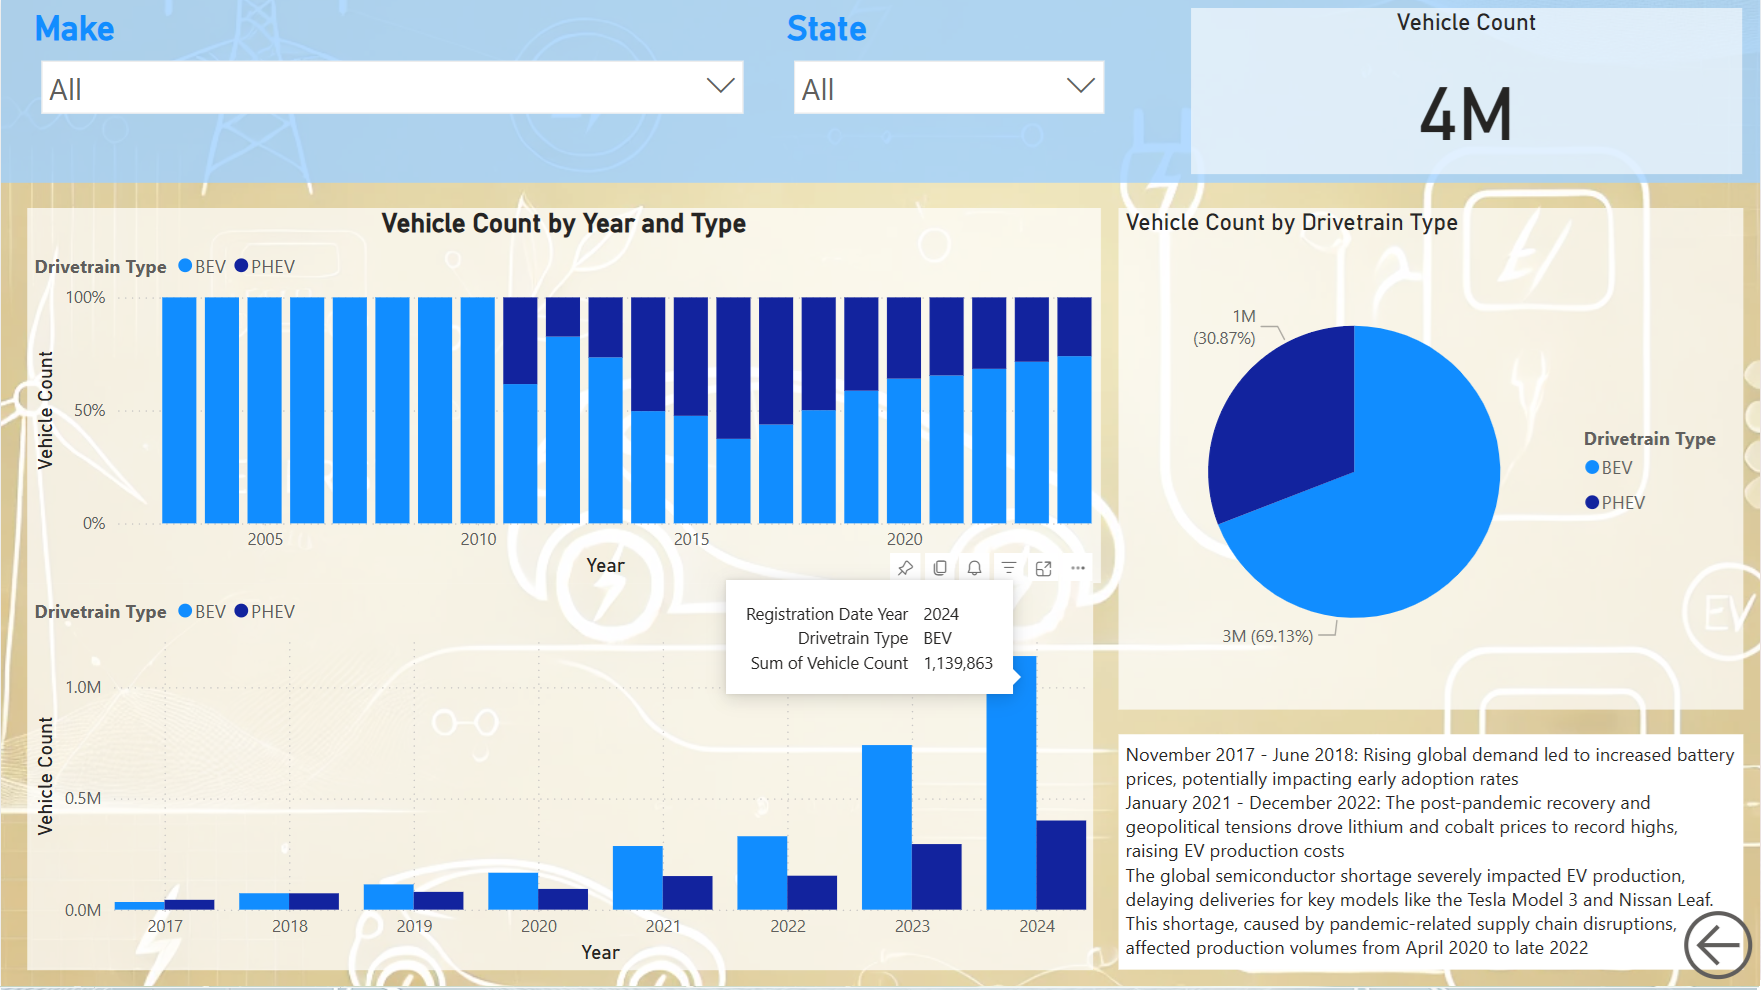
- Supply chain disruptions (e.g., semiconductors) slowed down production
- Battery cost fluctuations impacted pricing and accessibility
- COVID-19 briefly decreased registrations but post-stimulus recovery followed
- Tesla’s resilience stood out compared to traditional automakers
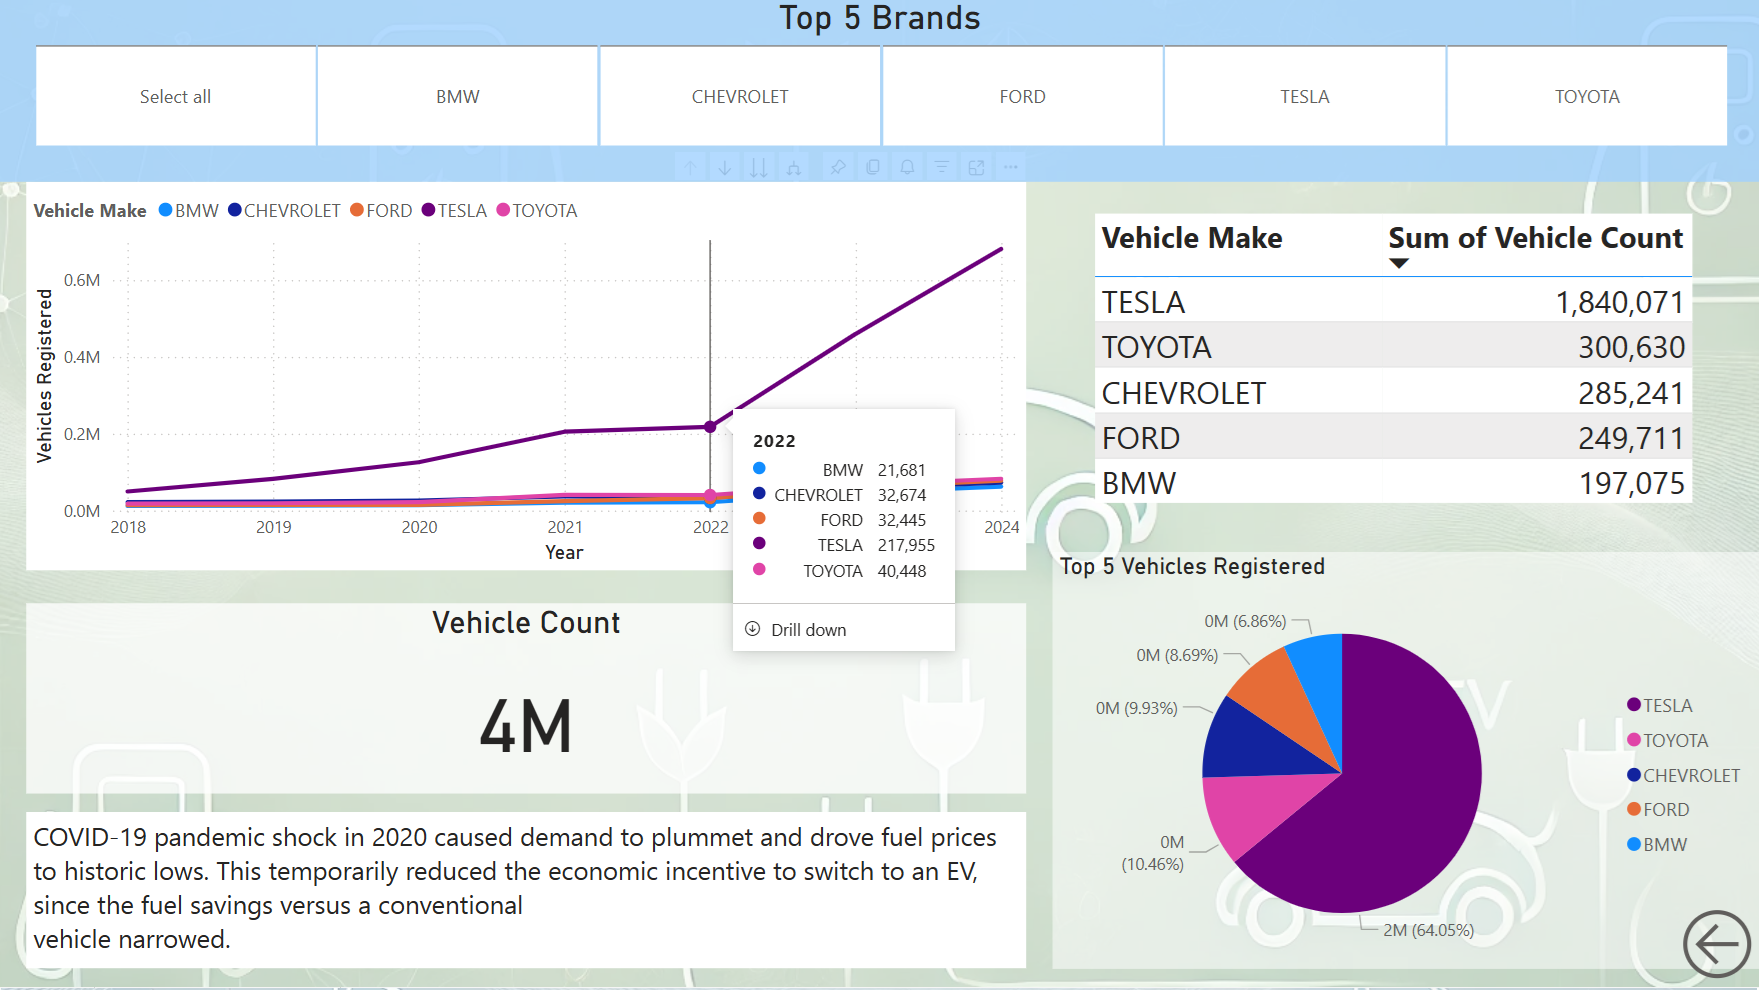
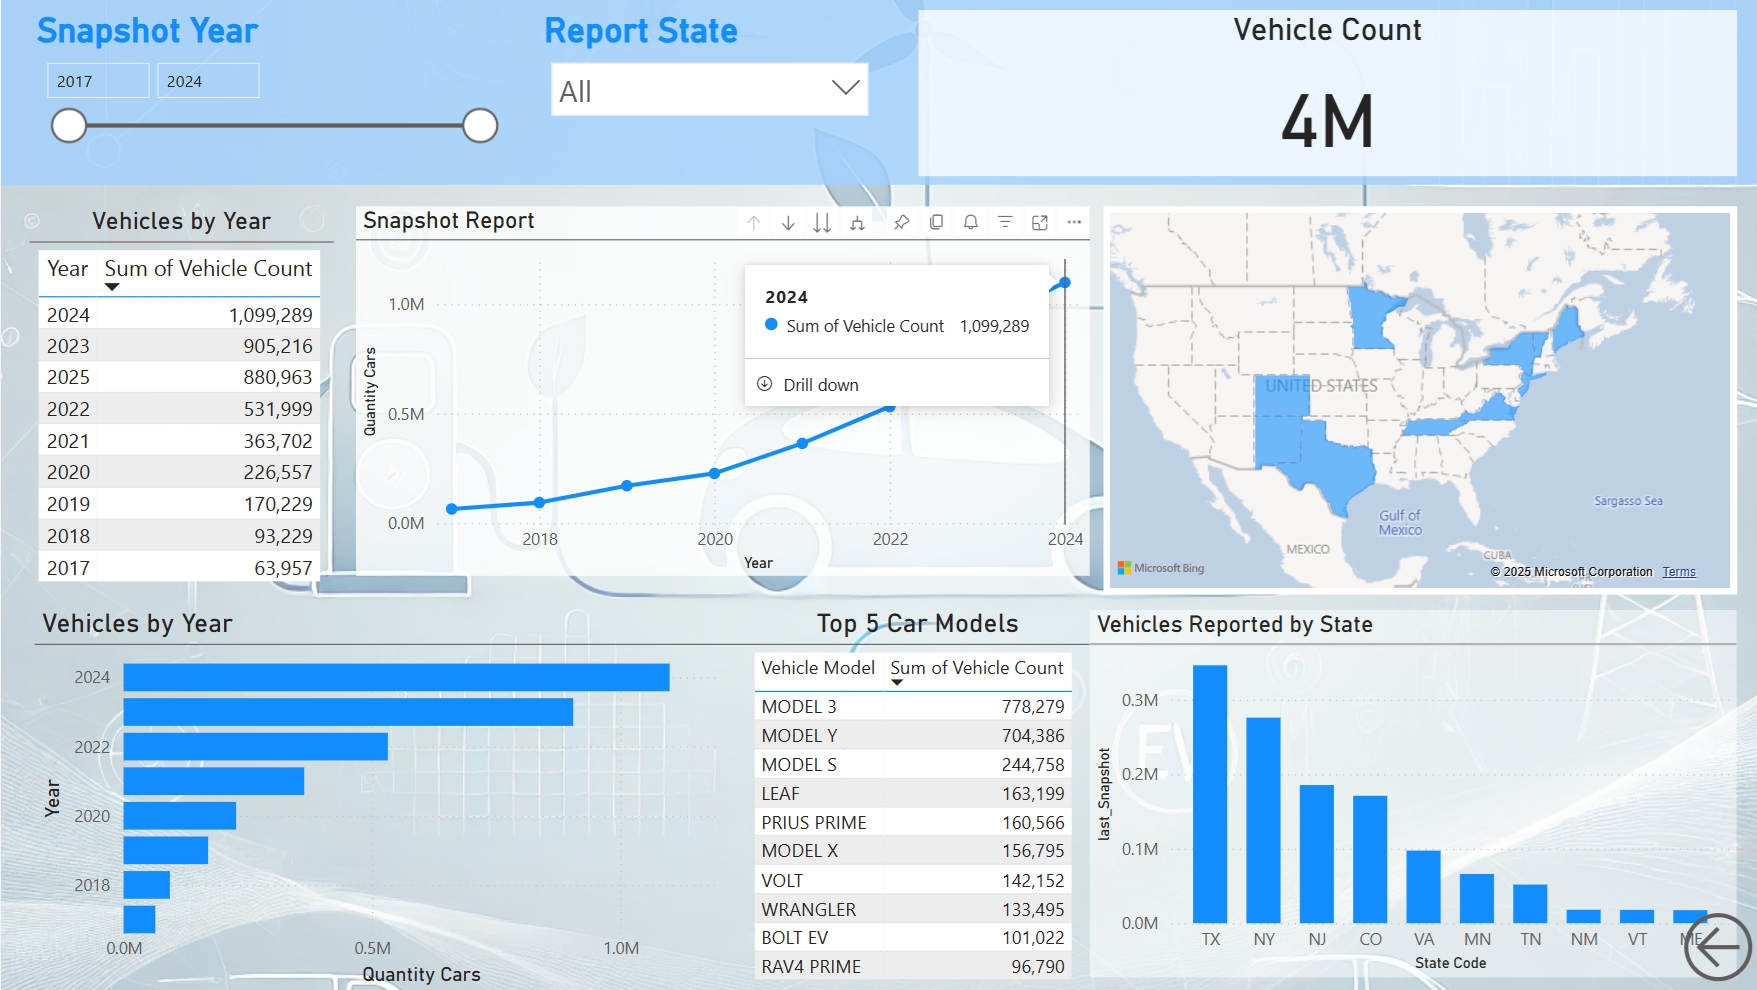
State-Level Dashboard Visuals
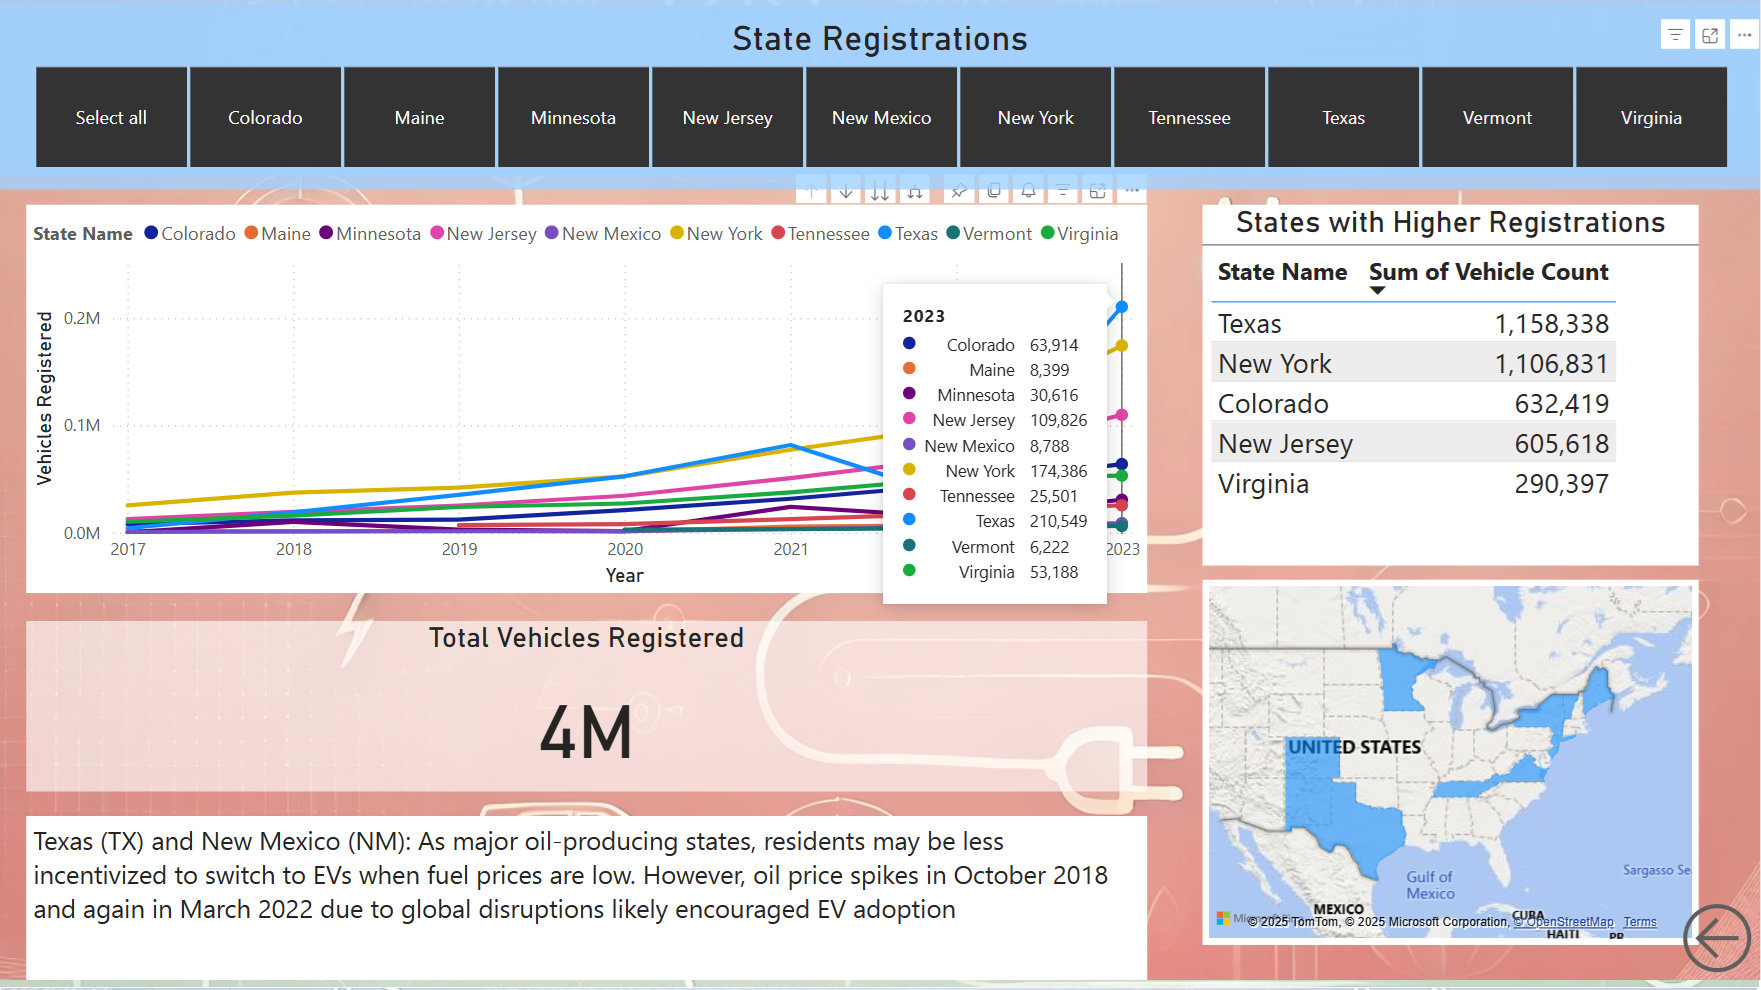
The Power BI dashboard highlights EV registration patterns by state. Some examples:
- New York and California show exponential growth
- Texas leads in numbers but with slower relative growth
- Minnesota accelerated post-2020 with policy changes