Power BI – Sales Data Modeling and DAX
This project demonstrates a complete data modelling workflow in Power BI using DAX and data transformation techniques.
Dataset & Model
- Fact table: Sales, connected to dimension tables for Customers, Products, and Regions.
- Custom Date Dimension (DimDate) created with
CALENDARAUTO()and enriched withYear,Month,YearMonthand more. - Customer segmentation by age group:
0–20,21–30,31–40, and>41.
Key DAX Measures
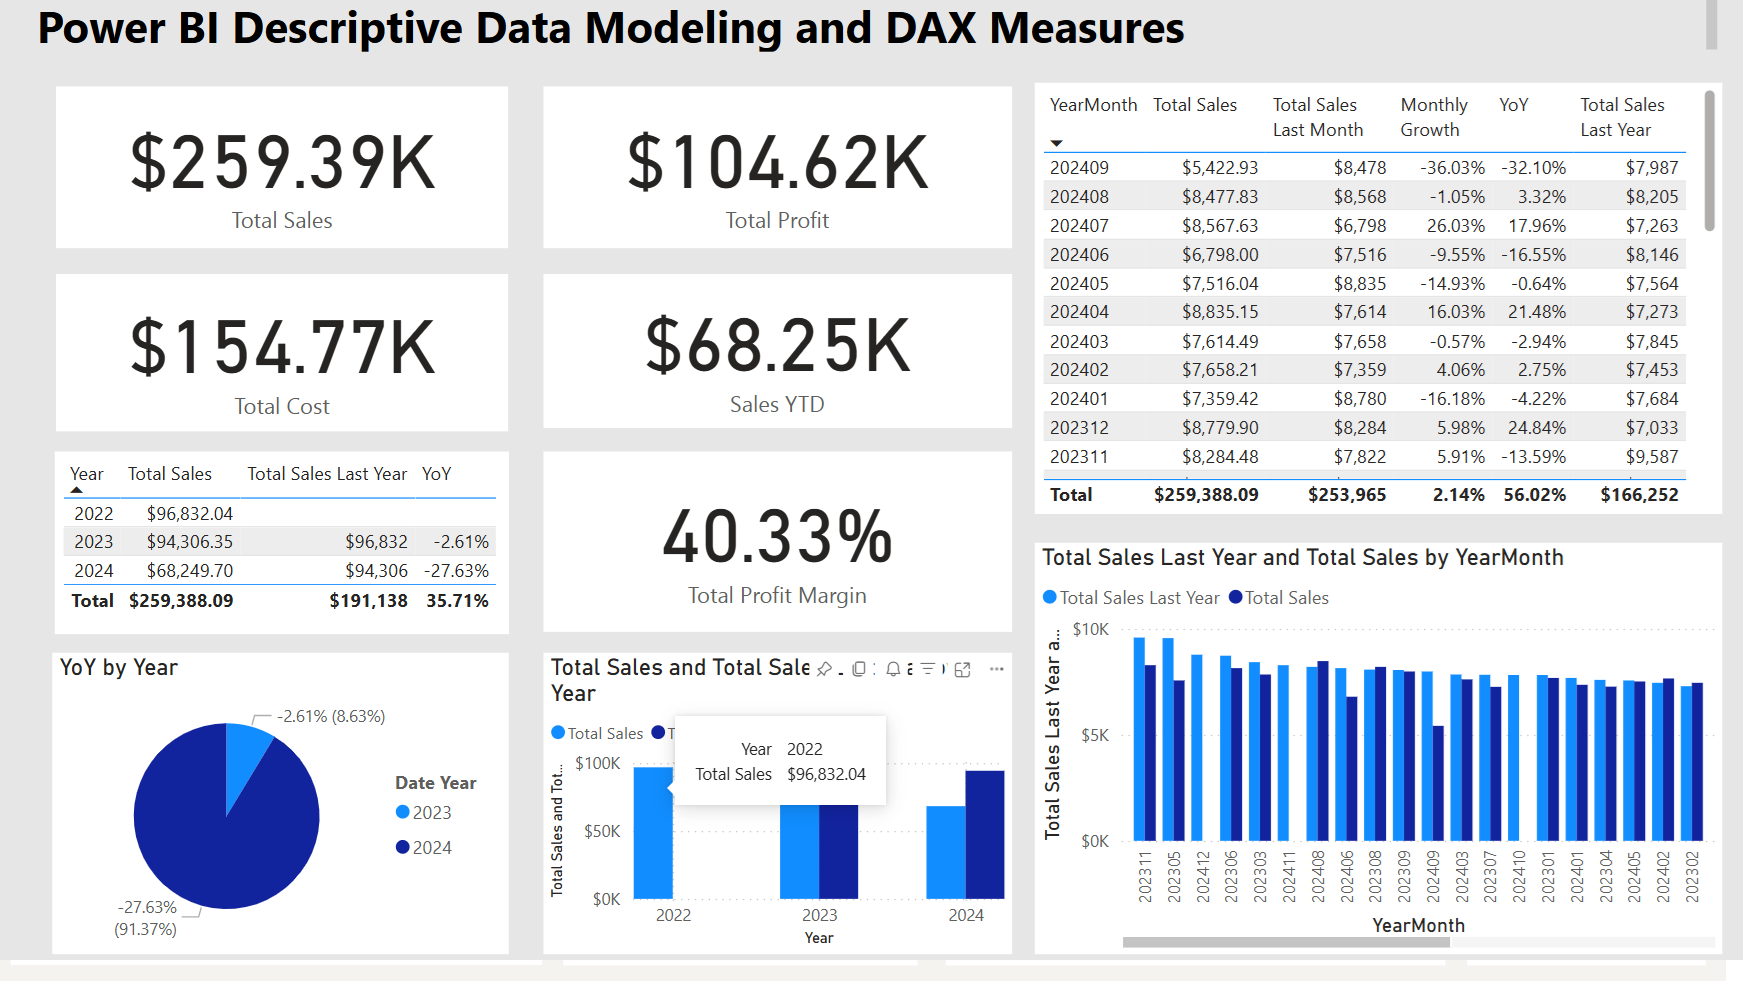
Total Sales,Profit,Profit Margin,Sales YTDMonthly GrowthandYear over Year (YoY)metrics- Customer insights:
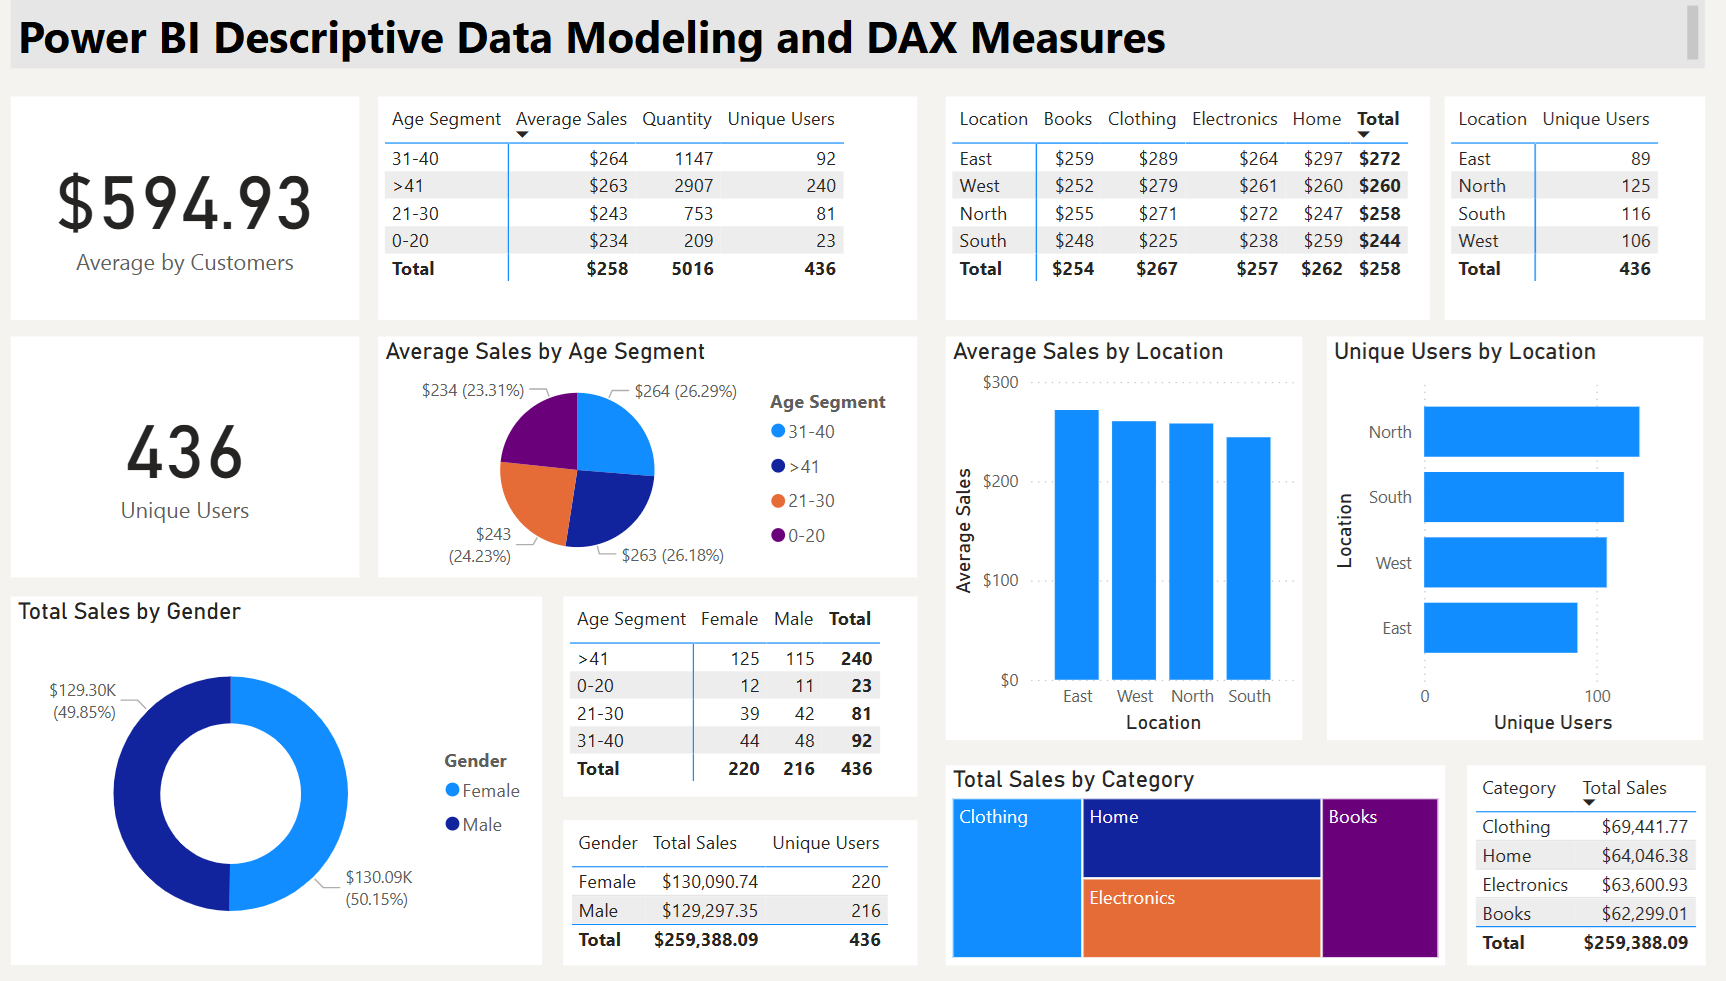
Average Sales per Customer,Unique Users
Report Highlights
- Two report tabs: Sales Overview and Customer/Product Profiles
- Interactive visualizations driven by DAX measures and data transformations
Optimization & Challenges
Model optimization included replacing calculated columns with DAX measures to improve performance. Difficulties were faced with date-based calculations and region-customer relationships due to incomplete source data.