Global Trade Analytics: Python & Tableau
Comprehensive business case study analyzing 34 years of worldwide export/import, tariffs, and trade balances. Combined Python (EDA, regression, Random Forest, statistical testing) and Tableau (interactive dashboards, maps, trends) to answer key hypotheses and reveal how policy and global events impact economic flows.
Tools & Techniques:
- Python: Pandas, NumPy, Matplotlib, Seaborn, Scikit-learn
- Regression, Random Forest, Pearson correlation, t-tests
- Tableau: interactive dashboards, global maps, trend and impact analysis
- Hypothesis-driven research, time series & panel data analysis
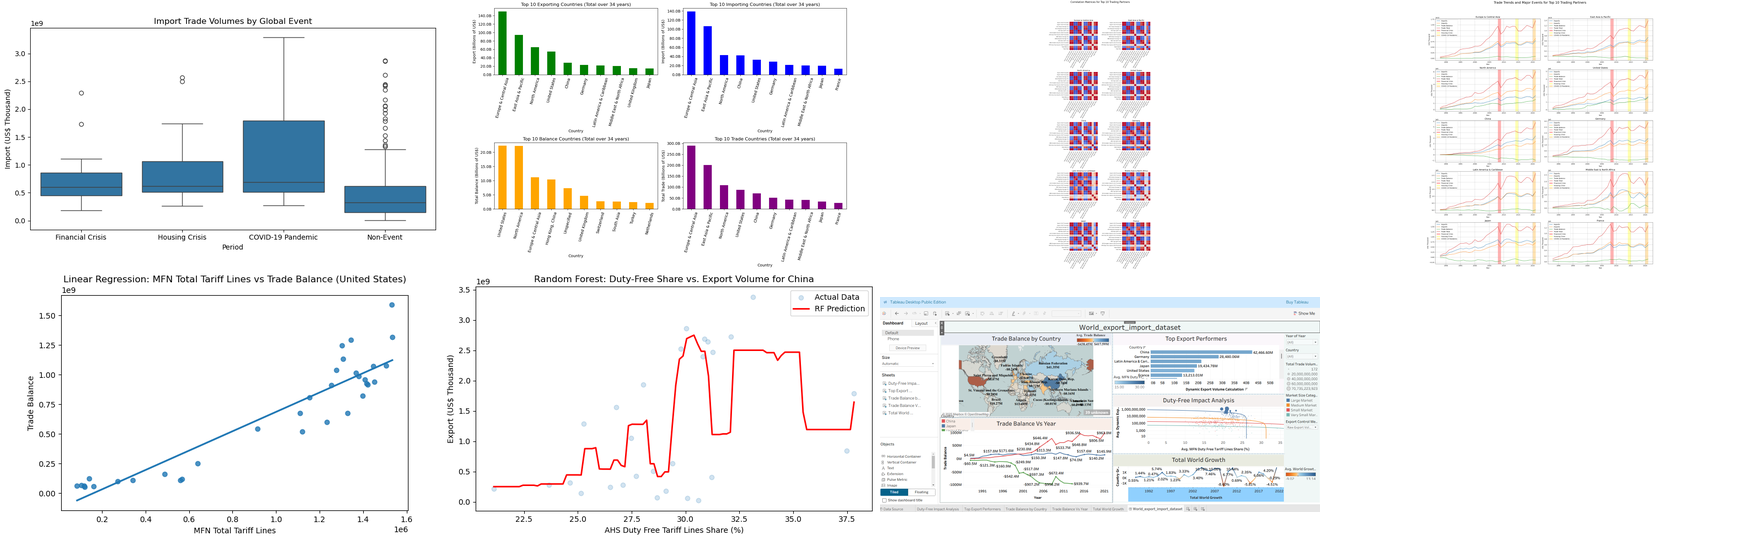
Key Insights:
- China and Germany: Negative correlation between tariff rates and trade balance; higher tariffs decrease trade balance.
- Other economies: Many developed countries show a surprising positive correlation—highlighting complexity in global trade policy.
- Duty-free access: Higher duty-free rates boost exports for some (Japan, US), but not universally.
- Major events: 2008 crisis and COVID-19 clearly disrupt global flows; trade rebounds show economic resilience.
Business & Policy Impact: Results inform government strategies, help businesses optimize global sourcing, and provide a roadmap for resilient, evidence-based trade policy in an uncertain world.
Explore the interactive dashboards:
