Iris Dataset Analysis – Power BI + Python
This project explores the classic Iris dataset through Python preprocessing and visual analytics in Power BI:
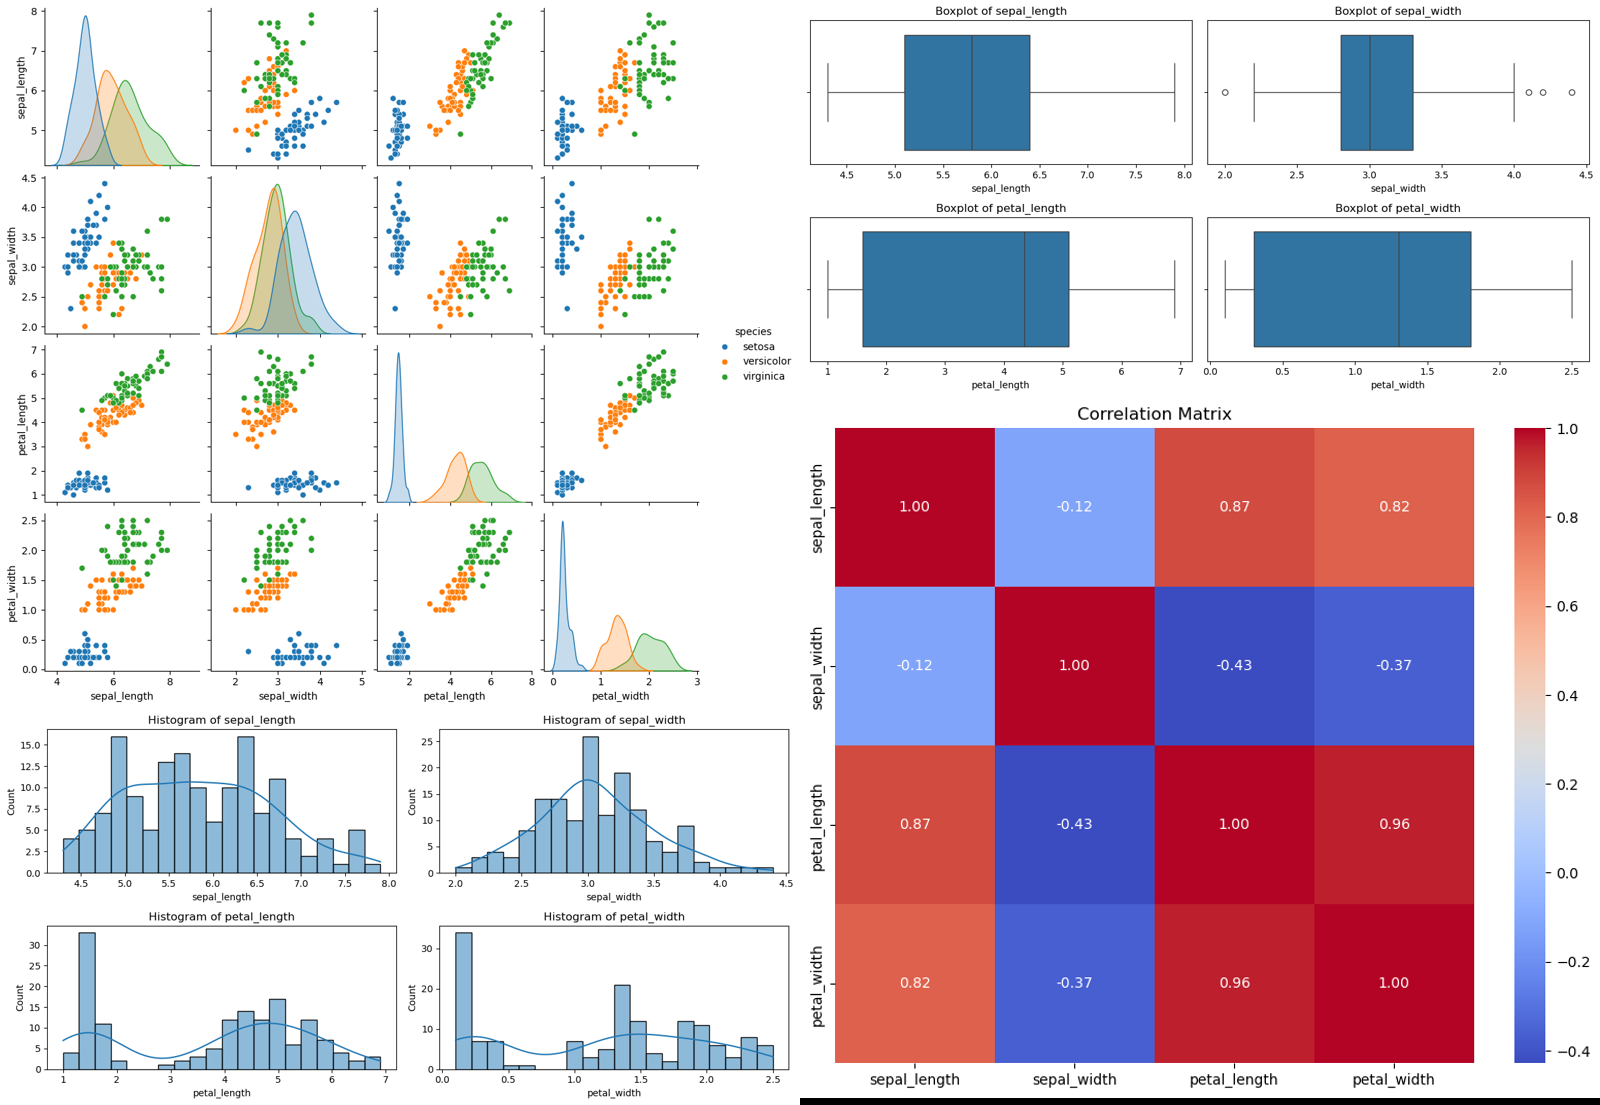
- Data Preparation: Cleaning and feature creation using pandas and matplotlib.
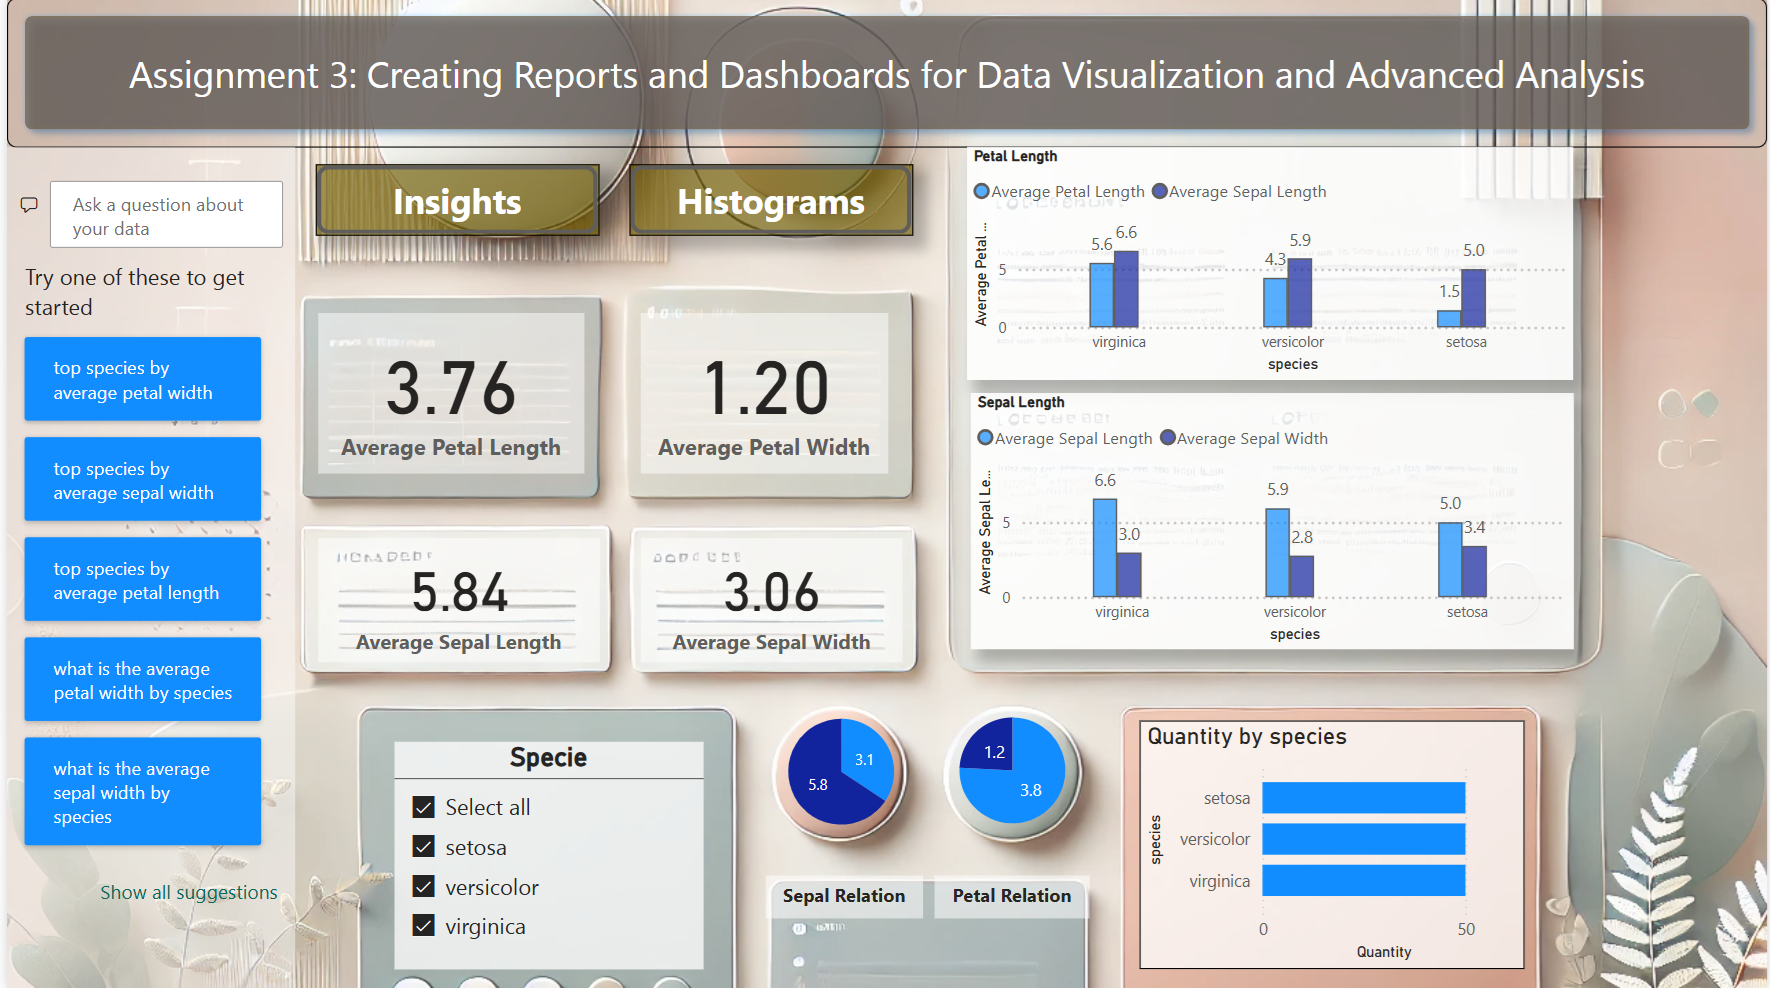
- Interactive Dashboard: Visual segmentation by species, petal/sepal length, and width.
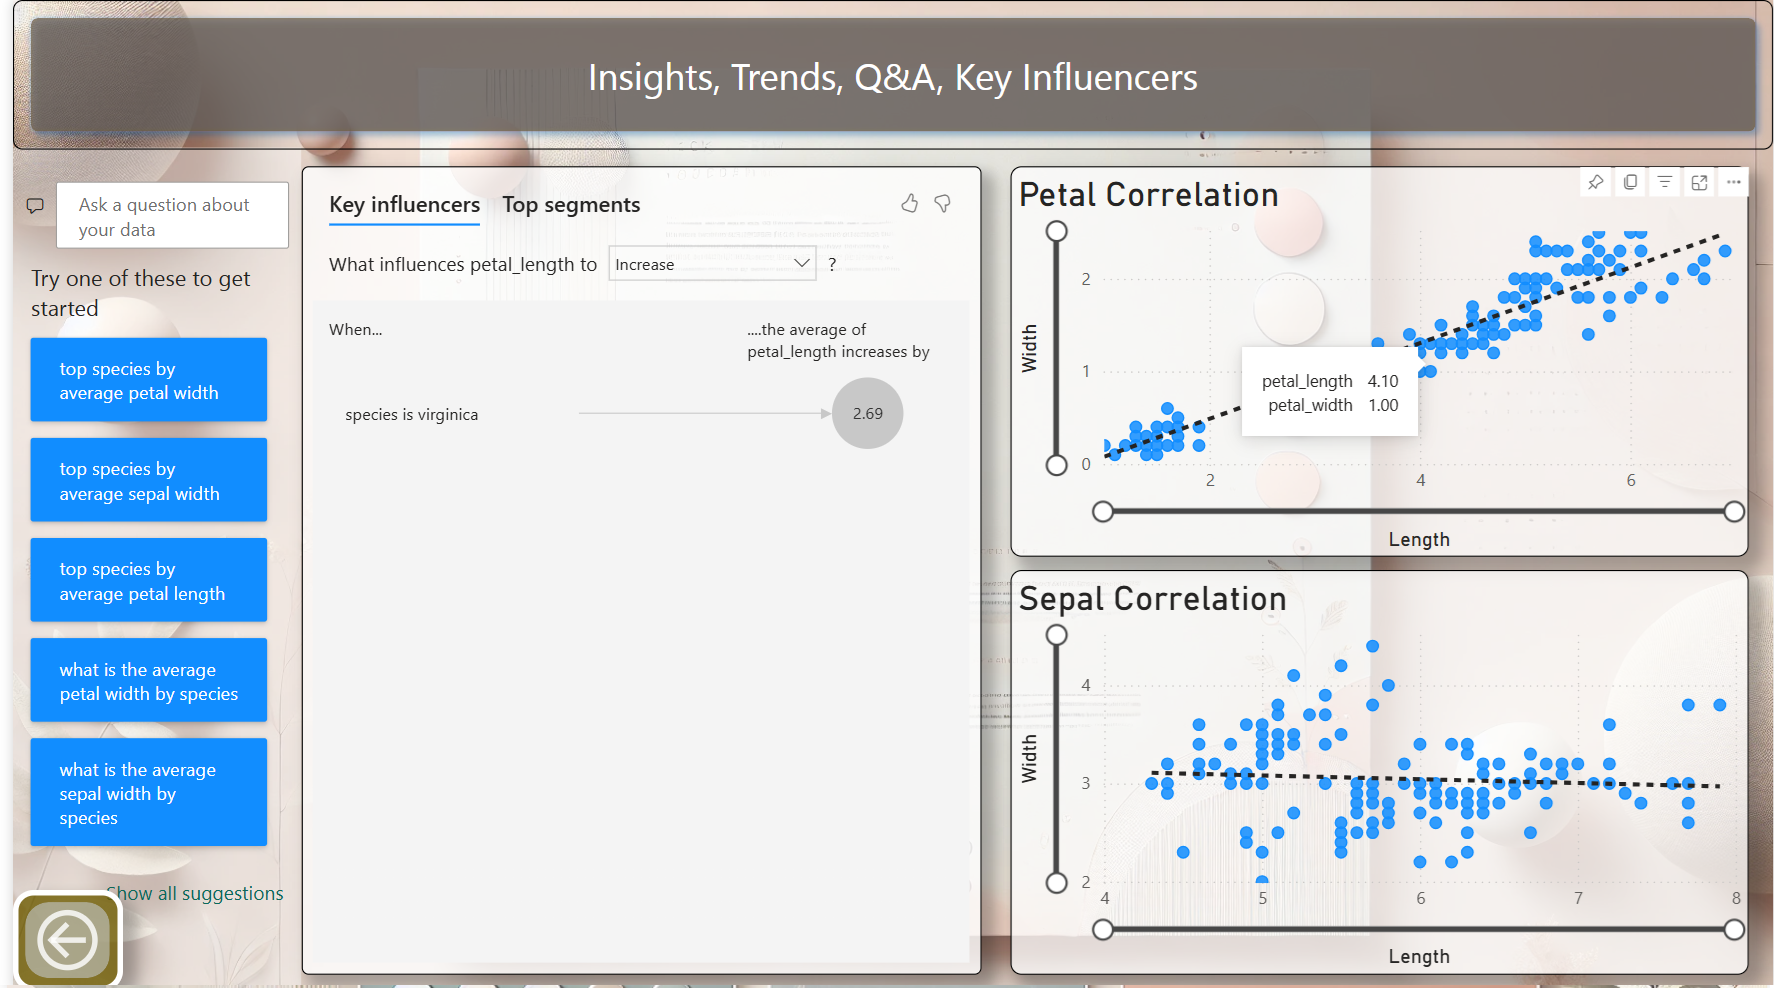
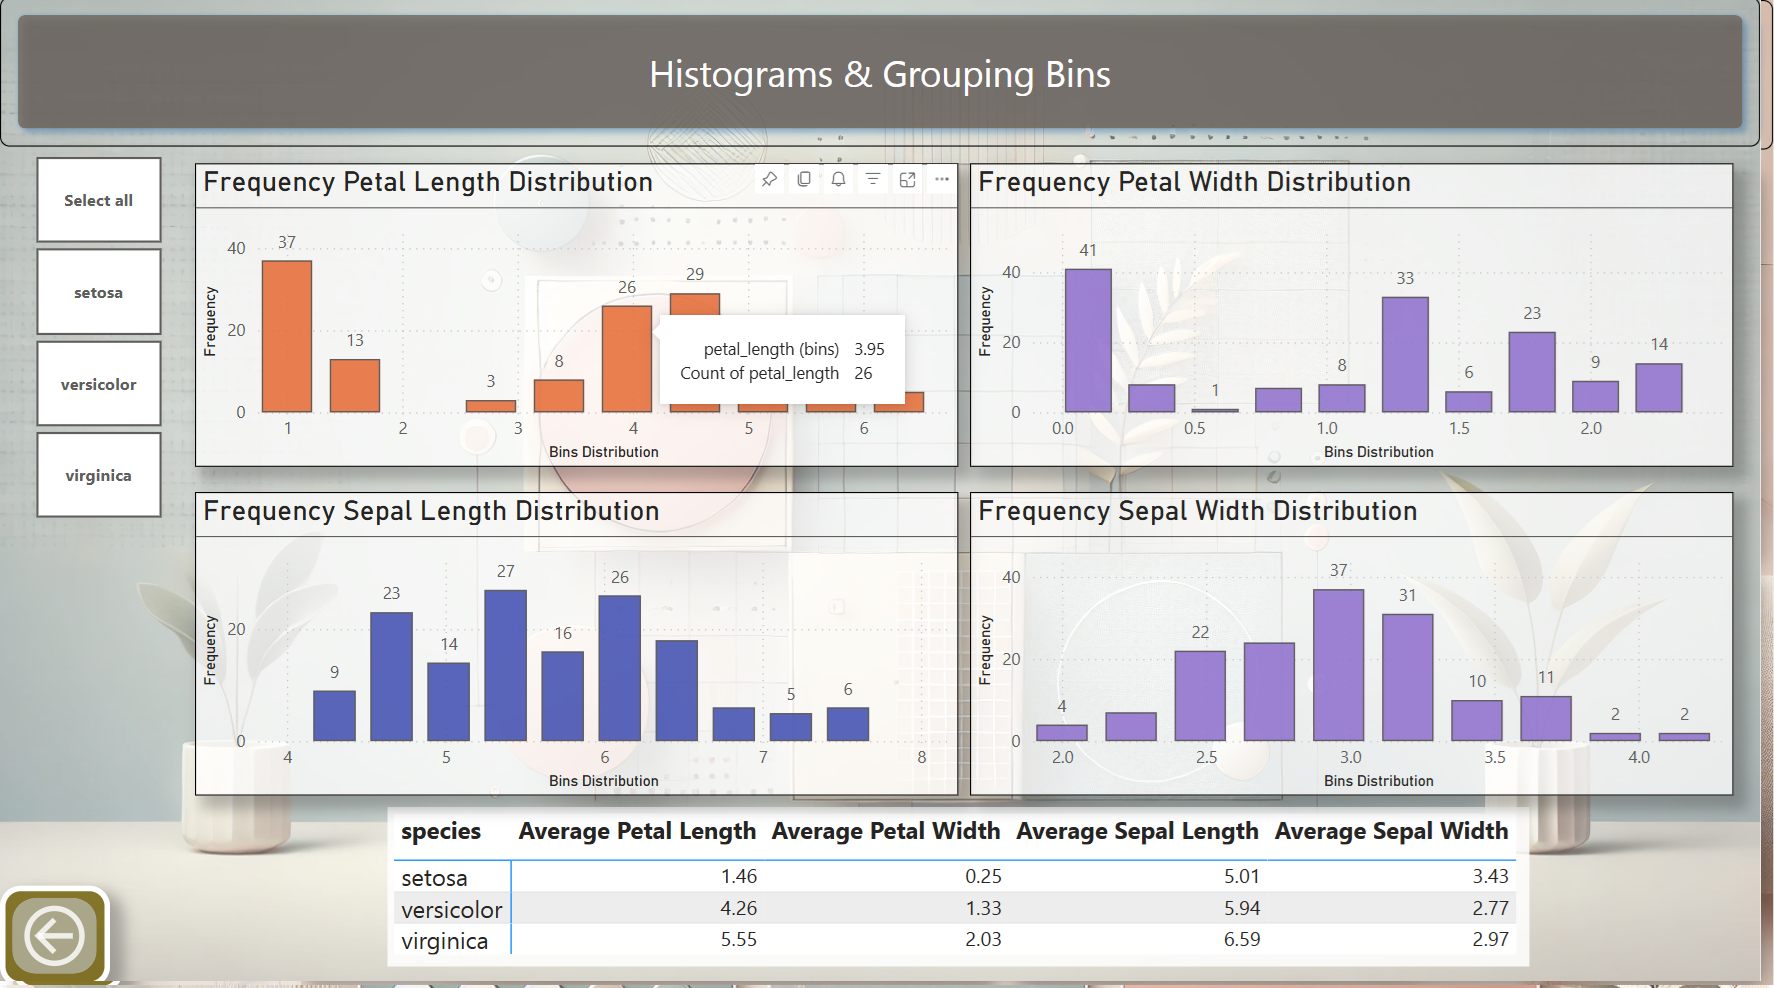
- Statistical Summaries: Grouped insights on measurement distributions.
- Combined View: Power BI dashboard with embedded Python visuals.
Combining Python preprocessing with Power BI’s visual capabilities improves both data quality and user engagement in analytics storytelling.