Advanced Visualizations & Insights (Tableau)
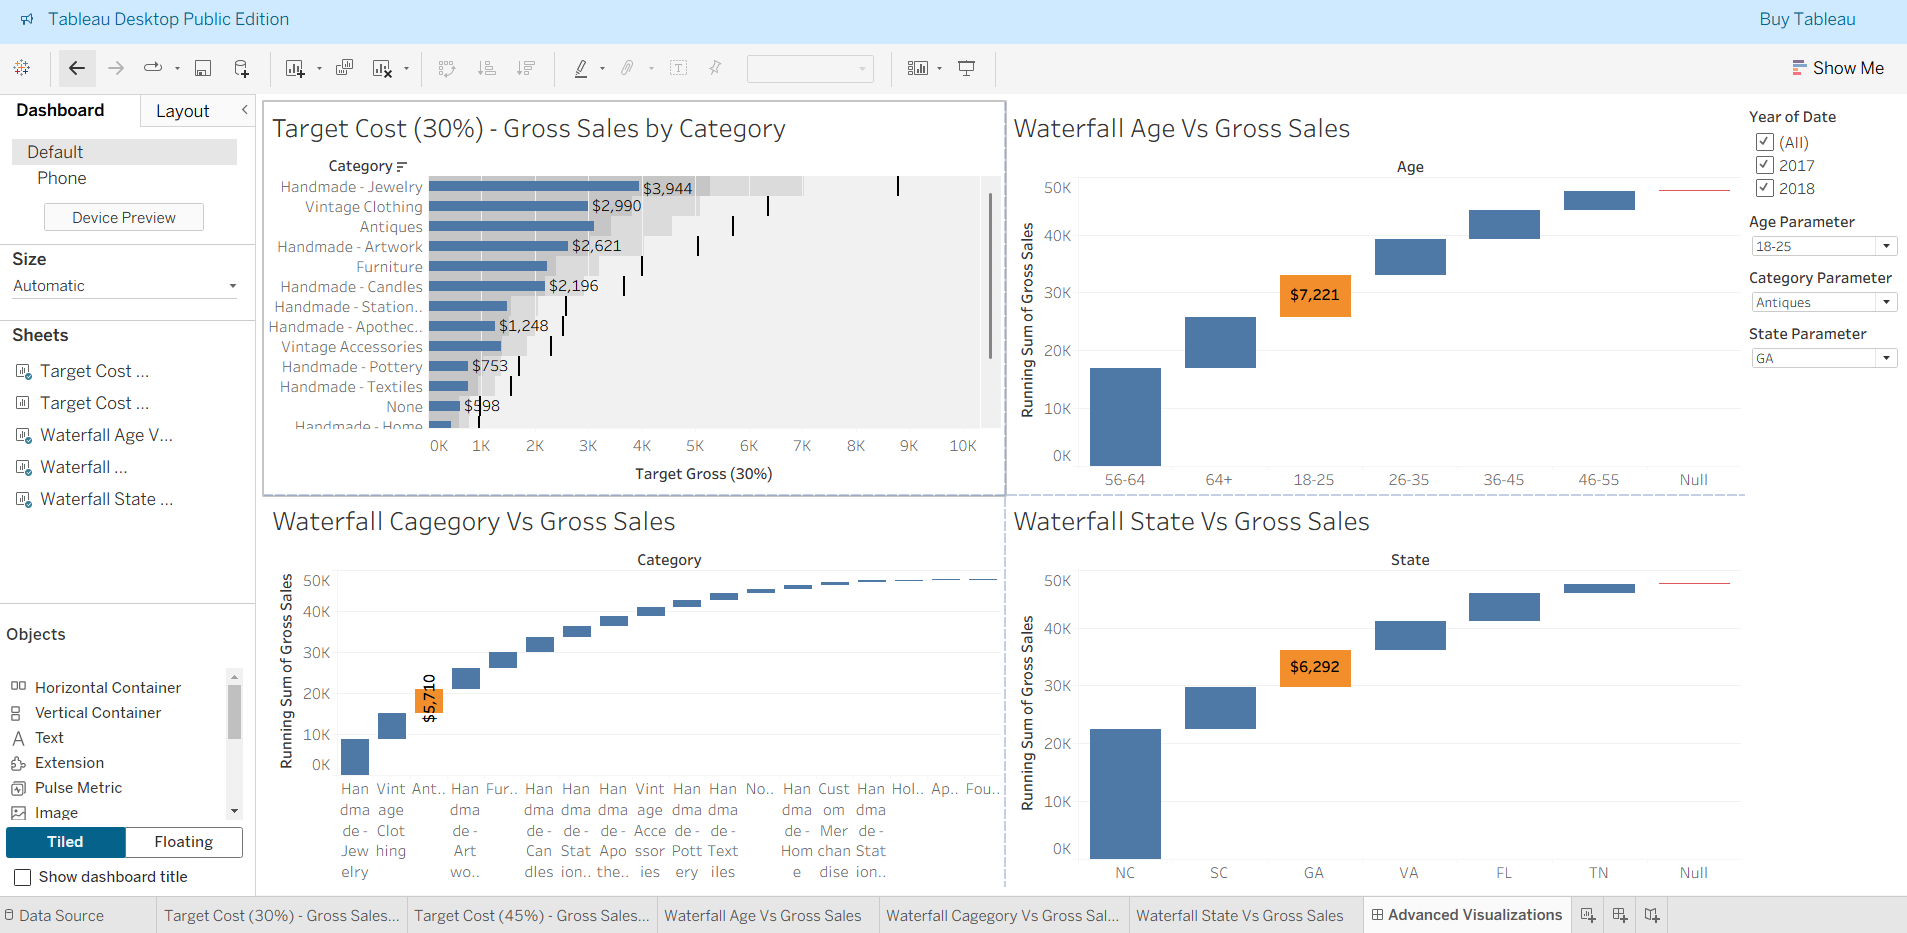
This project demonstrates the use of advanced Tableau features for business intelligence. Explore multi-layered dashboards with sophisticated charts, interactive filtering, and spatial analysis, empowering users to discover actionable patterns in complex data.
Tools & Techniques:
- Tableau Public
- Custom calculated fields & filters
- Spatial, categorical & trend visualizations
- Interactive parameter controls
Key Insights:
- Unlock hidden trends with advanced visual combinations
- Segment data dynamically using interactive controls
- Deliver clear, visually impactful business intelligence
Explore the dashboard:
