Data Analytics: Tackling the Data
Steps for Descriptive Analytics
The following infographic illustrates the step-by-step process:
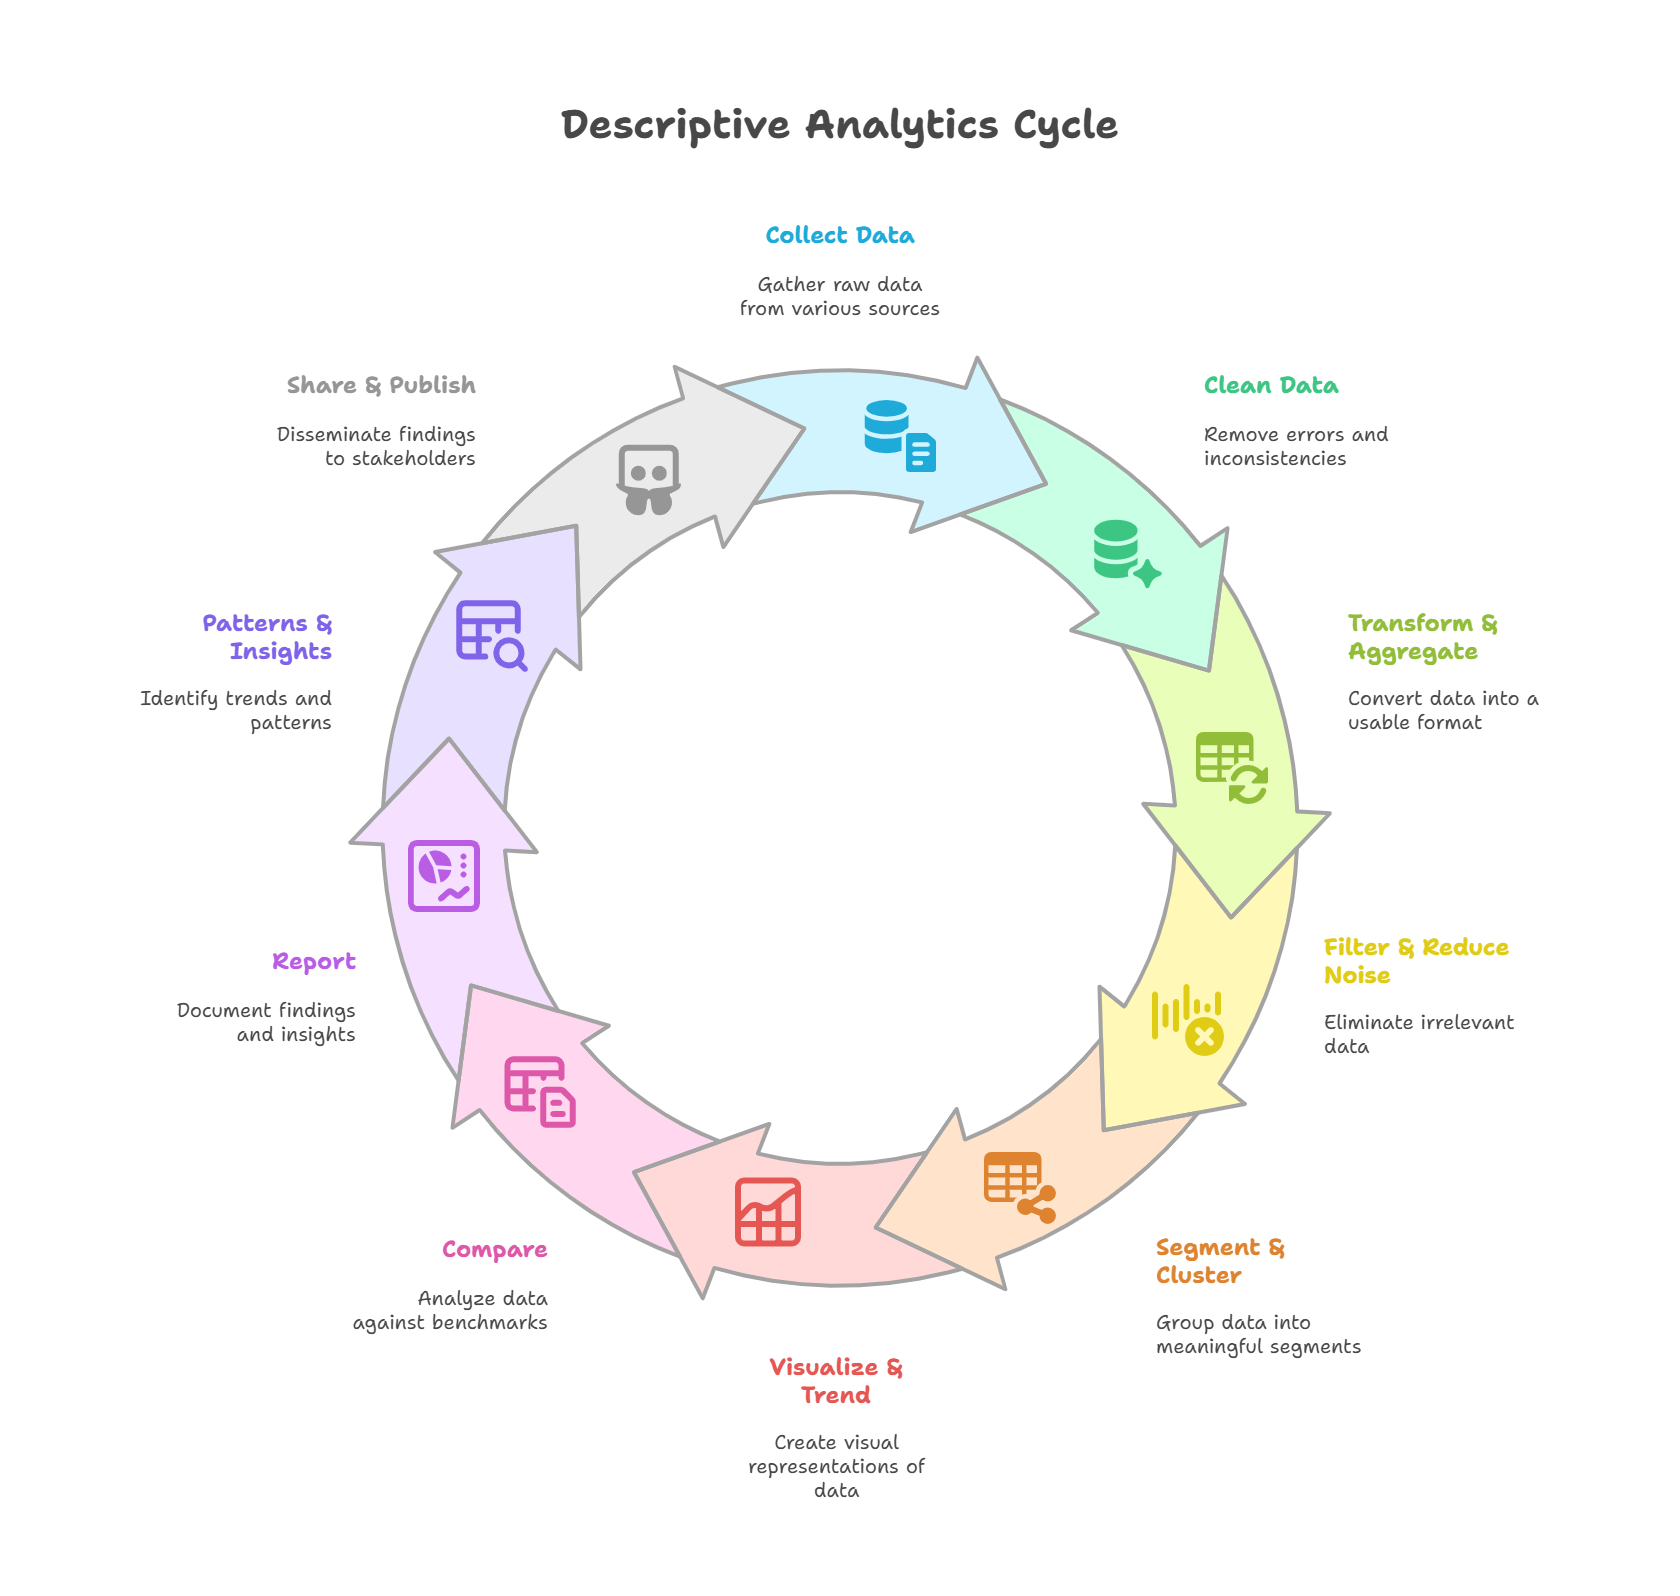
Descriptive Analytics is the foundation of data-driven decision making. It focuses on understanding what happened in the past by organizing and summarizing historical data. Below are the 10 essential steps:
- Collecting Data: The first step involves gathering raw information from diverse sources such as databases, APIs, spreadsheets, surveys, sensors, or system logs. This stage is crucial to ensure that the dataset covers all necessary dimensions for the analysis. The quality and relevance of the data collected directly impact the reliability of the insights generated later.
- Cleaning Data: Raw data is often incomplete, inconsistent, or inaccurate. This step includes detecting and removing duplicates, correcting errors, handling missing values, and standardizing data types. Data cleaning ensures that the dataset is reliable, consistent, and ready for accurate analysis.
- Transforming & Aggregation: At this stage, data is reformatted and consolidated for easier analysis. Transformation may include converting data types, normalizing values, or creating calculated fields. Aggregation involves summarizing data (e.g., monthly totals, averages, or counts) to highlight patterns and reduce complexity.
- Filtering & Reducing Noise: Not all collected data is useful. This step involves removing irrelevant variables, filtering out extreme outliers that may skew results, and reducing random fluctuations (noise) that do not represent meaningful trends. The goal is to keep the dataset focused on variables that provide valuable insights.
- Segmentation & Clustering: Here, data is divided into meaningful groups for deeper analysis. Segmentation is often rule-based (e.g., by region, age group, or customer type), while clustering uses algorithms (such as K-Means) to identify hidden patterns and natural groupings in the data. This step is essential for understanding differences within large populations.
- Visualization & Trending: Visualizations turn complex data into easy-to-understand graphics, such as bar charts, line graphs, heatmaps, or dashboards. Trending analysis helps identify growth, decline, seasonality, and other key patterns over time, making it easier for stakeholders to grasp insights at a glance.
- Comparing: Comparison enables the evaluation of performance across different dimensions, such as time periods, product categories, customer segments, or geographic regions. This step highlights differences and similarities that support benchmarking and informed decision-making.
- Reporting: In this step, insights are documented in structured formats such as dashboards, presentations, or written reports. A good report is concise, highlights key metrics, includes visual aids, and provides actionable recommendations tailored to its audience.
- Patterns & Insights: Beyond numbers, this step focuses on interpreting the meaning of the results. Analysts identify recurring behaviors, correlations, anomalies, or emerging opportunities. Insights often provide the foundation for business strategies, predictive models, and decision-making processes.
- Sharing & Publishing: Finally, results are communicated to stakeholders through dashboards, online portals, presentations, or publications. Effective sharing ensures that the insights reach the right audience, are easy to interpret, and can drive evidence-based actions across the organization.
Putting It All Together — The 10-Step Pipeline
Each step above is one stage of a single flow: raw data enters on the left, and a published, decision-ready insight comes out on the right. The companion notebook runs the whole thing end to end on a synthetic retail dataset generated in code — so it reproduces anywhere, with no external files.
Blue = data preparation | Violet = analysis | Teal = communication. The same flow the notebook runs end to end.
The Companion Notebook
The Jupyter notebook below implements every one of these ten steps in order, on the synthetic retail dataset, with the same pandas and SQL patterns shown on each step's page:
- Collect: generate 20,000 synthetic retail orders (seeded, reproducible).
- Clean: drop duplicates, fix data types, standardize text, handle missing values.
- Transform & aggregate: derive sales/profit, roll up to monthly metrics by region.
- Filter, segment, visualize, compare: trim outliers, cluster customers, plot the trend, compute YoY change.
- Report, find patterns, share: build the KPI summary, surface correlations and a Pareto concentration, export the deliverables.
Download: descriptive-analytics-pipeline.ipynb
Reference Library
Want these stages as reusable, tested code rather than a one-off notebook? The
Data Analytics Library is the
code companion to this series — a documented Python package that turns the same lifecycle
(loading, cleansing, exploration, visualization, and descriptive → diagnostic → predictive →
prescriptive analysis, plus a reusable ML pipeline) into composable, DataFrame-in /
DataFrame-out modules with 81 tests and CI.
View it on GitHub →