⚙️ Transforming & Aggregation
Making Data Ready for Analysis
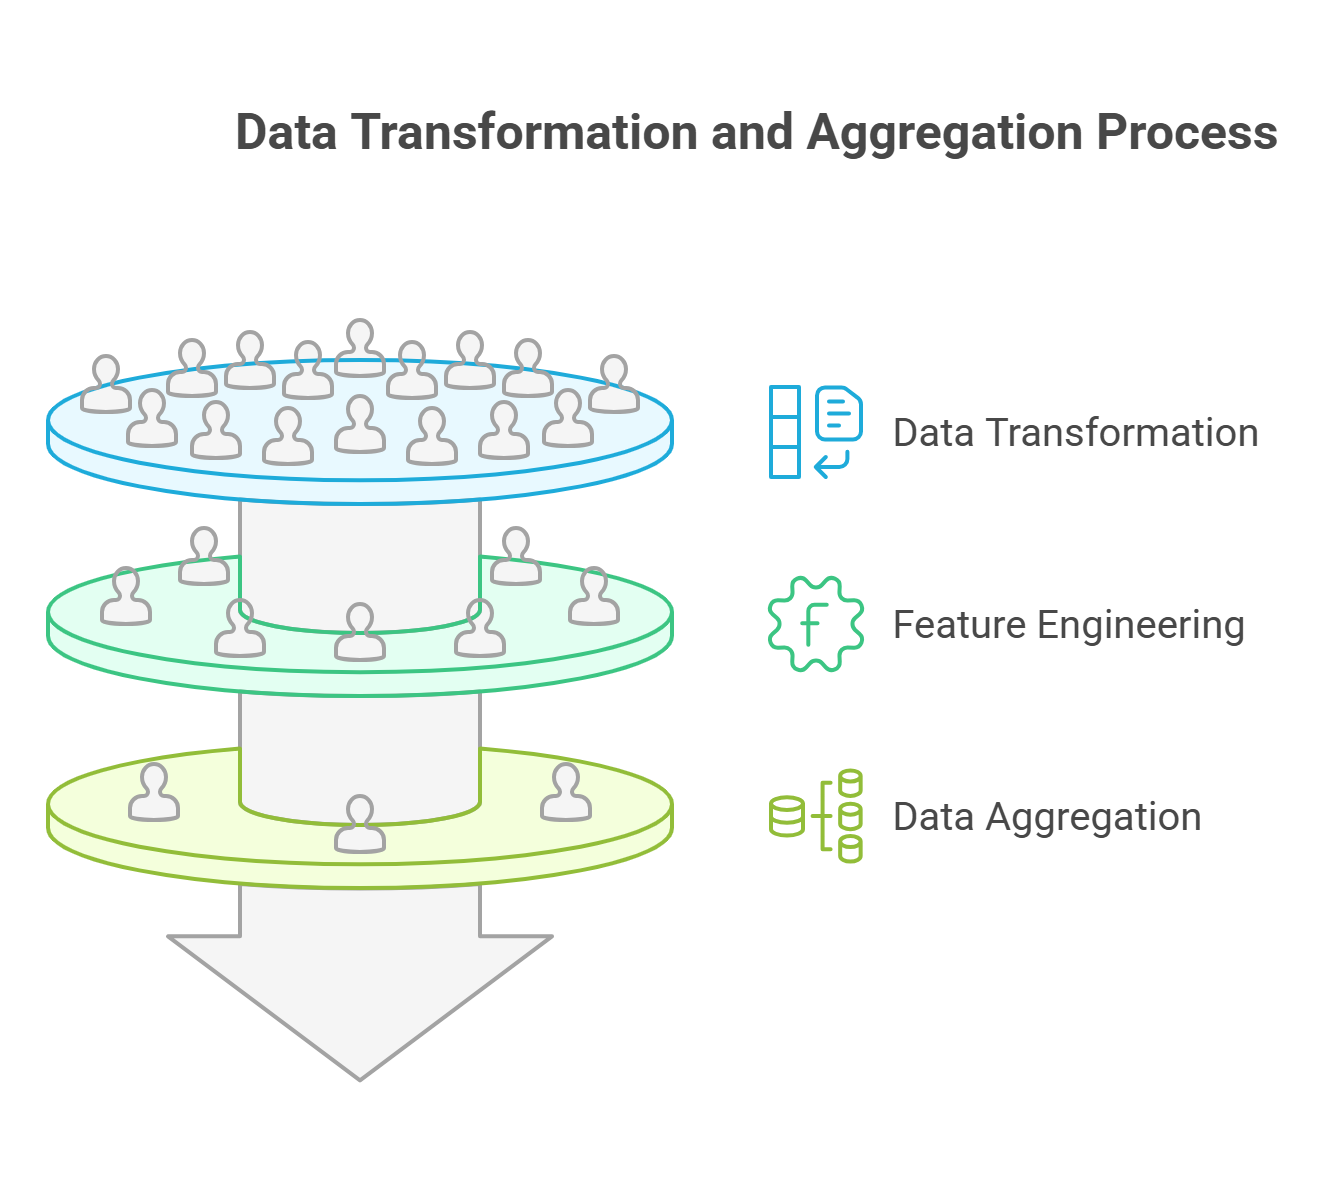
After collecting and cleaning data, the next step is Transforming and Aggregating. At this stage, raw but clean data is reshaped into structures that are easier to analyze and interpret. Transformation focuses on adjusting the format, scale, and relationships within the dataset — for example, converting categorical text into numerical codes, normalizing values to ensure comparability, or merging different sources into a unified dataset. This process often involves feature engineering, where new variables are created to capture additional insights that may not be directly available from the raw data.
Aggregation, on the other hand, condenses detailed records into higher-level summaries that highlight key trends and reduce complexity. This could mean grouping transactions by month, calculating averages or totals per category, or computing rolling metrics like moving averages to smooth fluctuations. The combination of transformation and aggregation not only makes large datasets more manageable but also ensures that the analysis focuses on metrics that are consistent, relevant, and aligned with business objectives. In essence, this step bridges the gap between raw data and actionable insights, preparing the ground for advanced analytics, visualization, and reporting.
🔄 Data Transformation
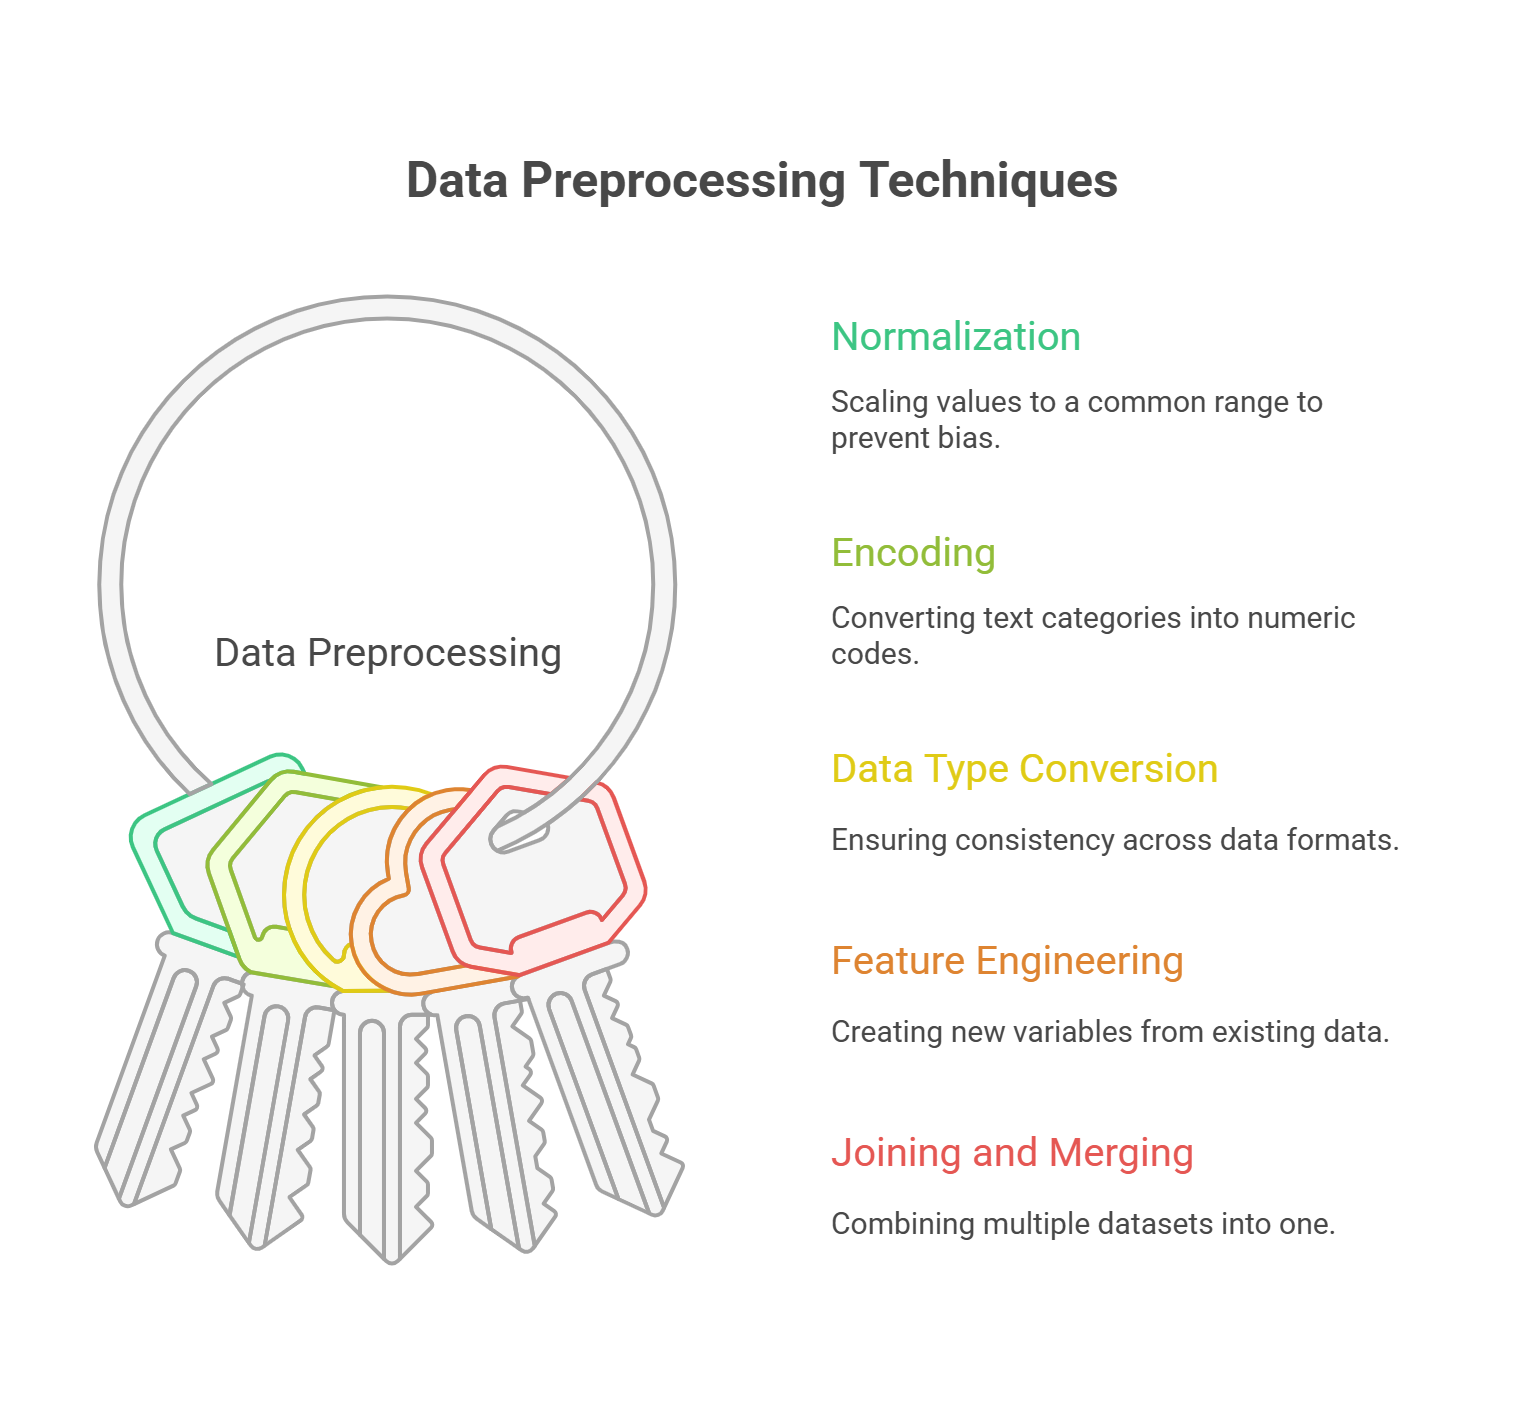
Transformation involves converting data into a format suitable for analysis. Common techniques include:
- Normalization: Scaling values into a common range to avoid bias (e.g., 0–1 for machine learning).
- Encoding Categorical Data: Converting text categories into numeric codes (e.g., one-hot encoding).
- Data Type Conversion: Ensuring consistency across formats (e.g., date strings to DateTime).
- Feature Engineering: Creating new variables from existing data (e.g., age from date of birth).
- Joining and Merging: Combining multiple datasets into a single, unified structure.
📊 Data Aggregation
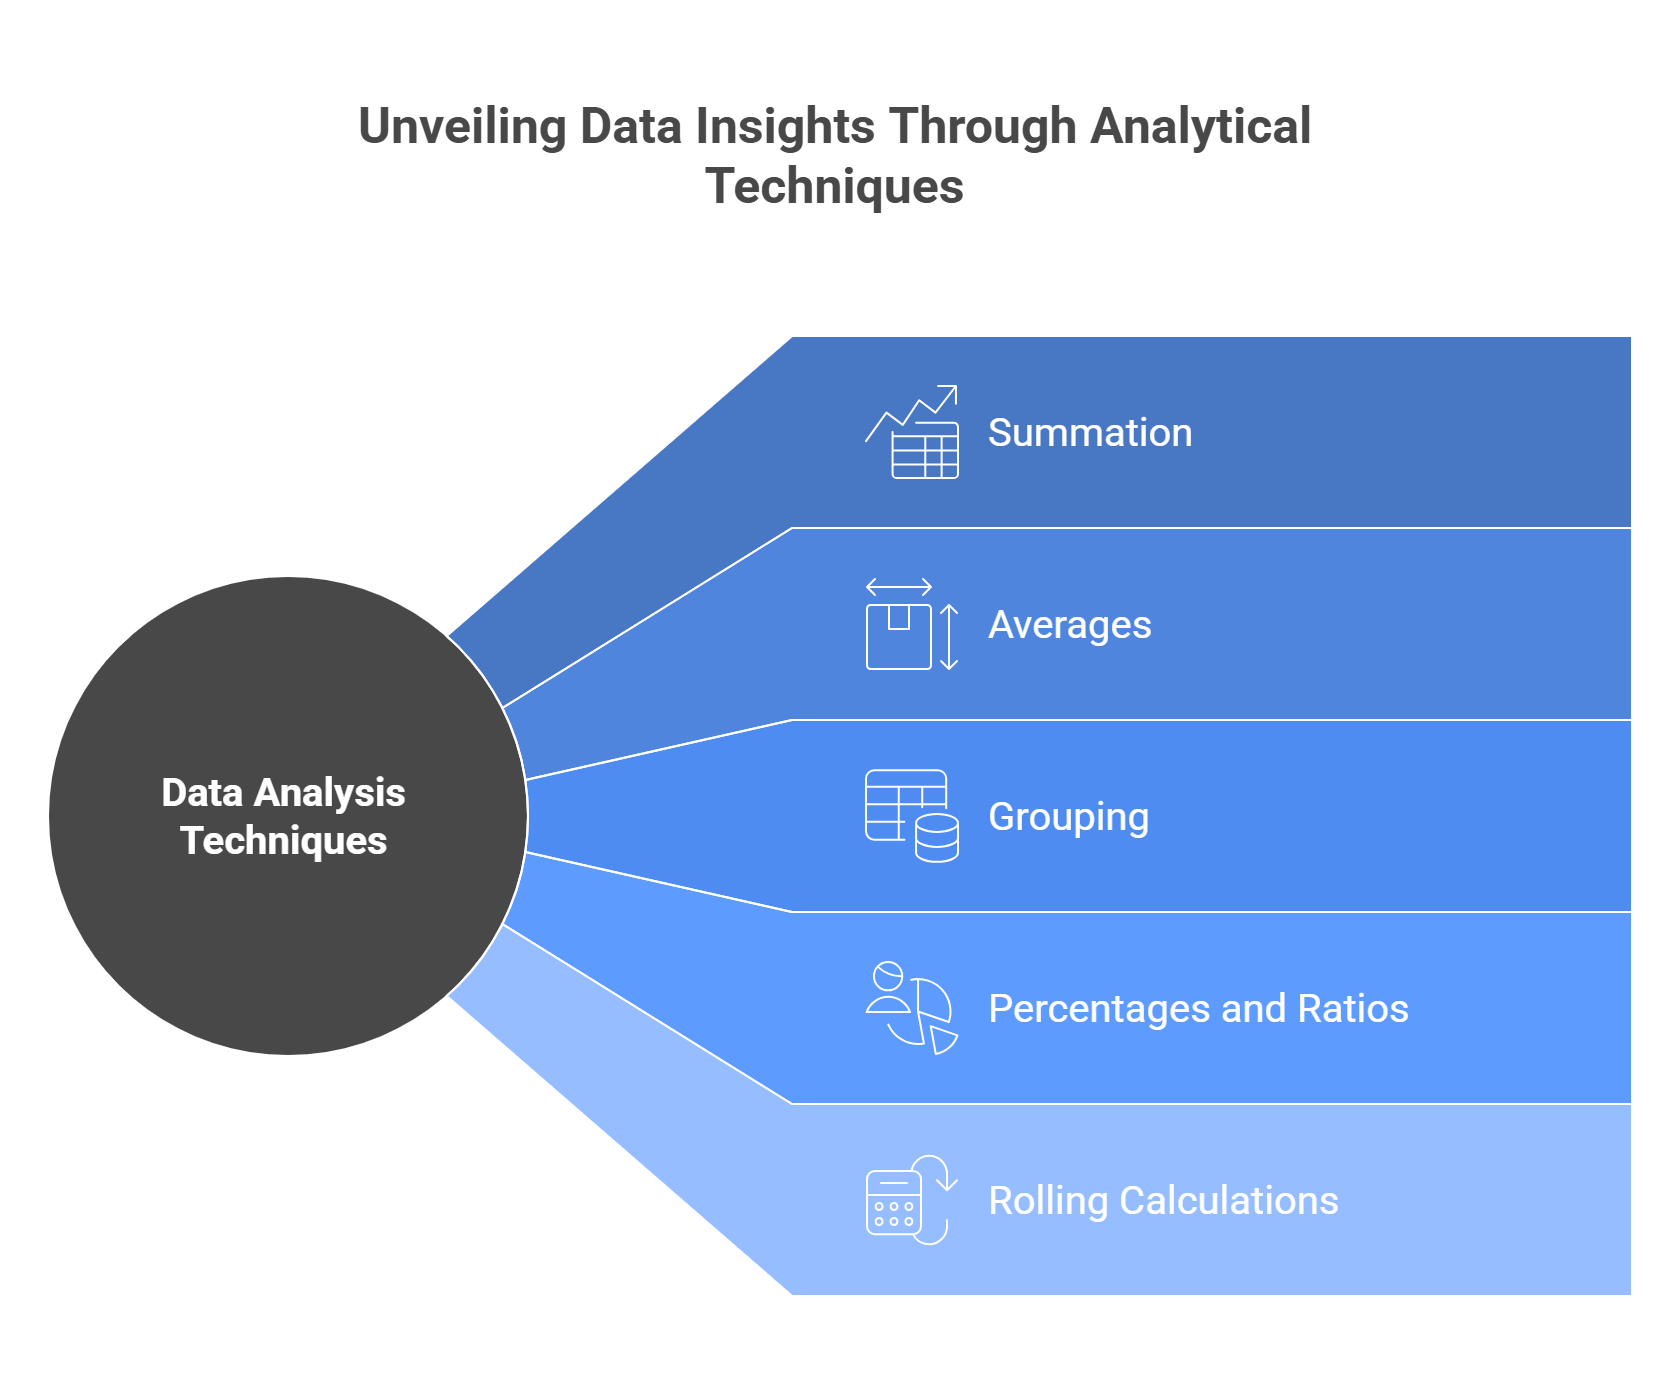
Aggregation helps summarize data into higher-level views:
- Summation: Total sales, revenue, or counts.
- Averages: Mean order value, average customer rating.
- Grouping: Results by time periods, regions, or product categories.
- Percentages and Ratios: Market share, churn rate, or profitability ratios.
- Rolling Calculations: Moving averages to smooth trends.
⚙️ Tools for Transformation & Aggregation
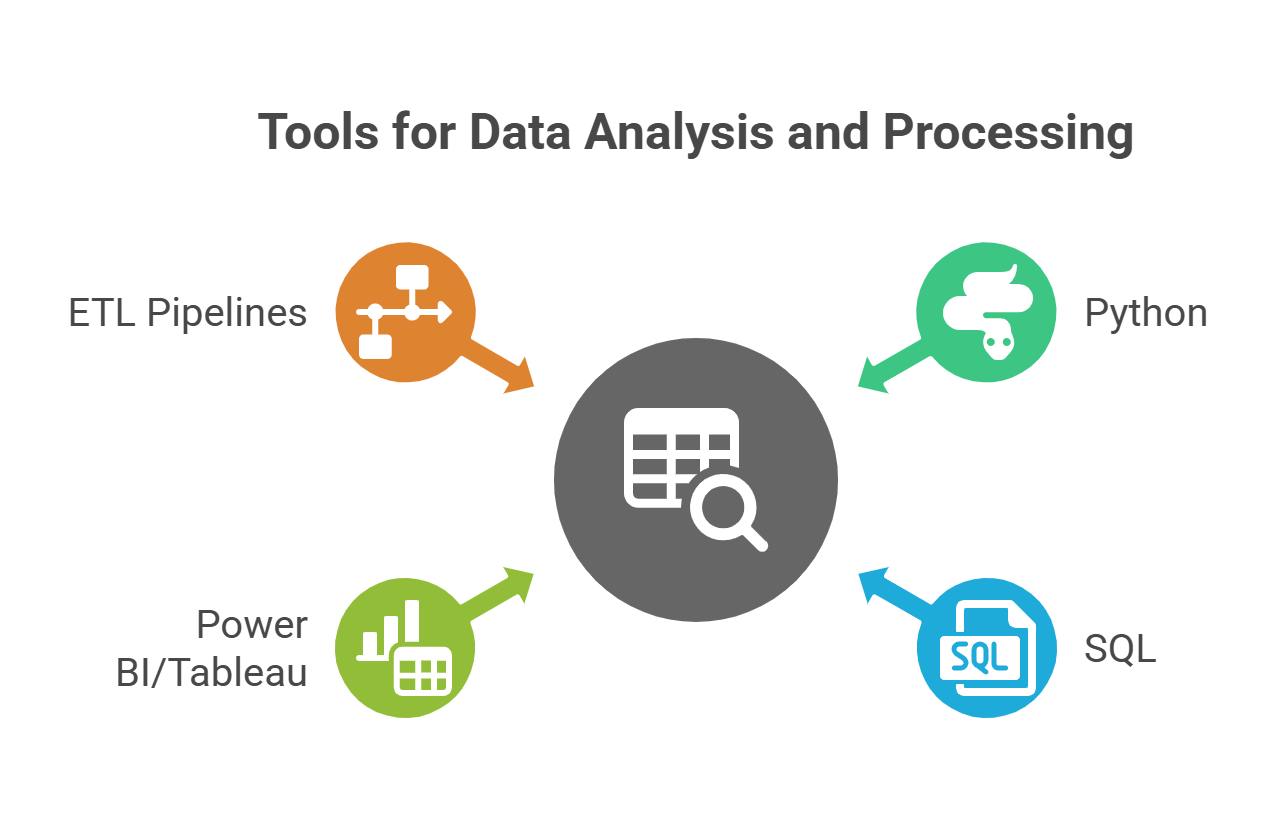
- Python: Pandas (`groupby`, `pivot_table`), NumPy, PySpark.
- SQL: `GROUP BY`, `JOIN`, `CAST`, and window functions for aggregation.
- Power BI / Tableau: Built-in transformations, calculated columns, and aggregation measures.
- ETL Pipelines: Talend, Informatica, AWS Glue, or Azure Data Factory for large-scale operations.
💡 Best Practices
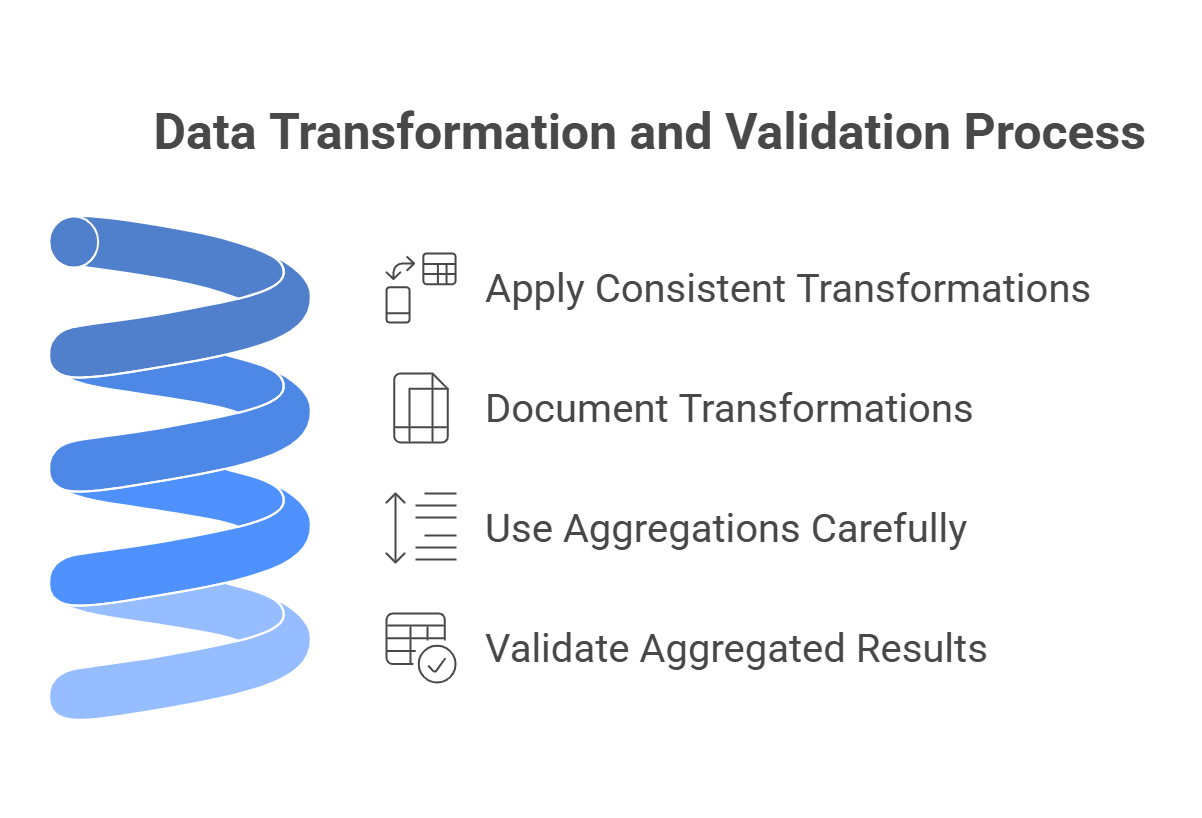
- Apply consistent transformations across all datasets to ensure comparability.
- Document every transformation for data lineage.
- Use aggregations carefully — avoid over-summarizing and losing valuable detail.
- Validate aggregated results against raw data to ensure accuracy.
📌 Example: Sales Data Transformation
Consider a dataset of retail transactions. Transformations may include:
- Converting transaction timestamps into calendar dates and extracting week or month.
- Joining product tables to attach category and supplier details.
- Encoding customer loyalty levels as numeric values.
Aggregations could include:
- Total monthly sales per region.
- Average basket size per customer segment.
- Moving average of revenue to identify seasonal patterns.